Headline
Fraction of (time, channel) cells each method flags across the night for the selected channel and polarisation.
For AOFlagger and CASA, a cell counts as flagged when at least the threshold fraction of cross baselines are flagged (log slider, 0.2% to 90%).
The default is 5%. That's where the AOFlagger strategy shown (mwa-1cc-sensitive) agrees best with SSINS and bayesian-rfi. CASA rflag and tfcrop flag only ~0.1–0.3% of baselines per cell outside bursts, and even at the 19:28 burst rflag peaks below 50%, so a 50% threshold leaves rflag with no flags at all. Input-flagged cells (Birli's first timestep of each observation) are excluded. EAVILS is not differenced, so slow sky drift raises its |z| as well as RFI.
Z-score baseline: Night renormalises SSINS, Birli SSINS z and EAVILS over all the observations, about a mean + linear slope in time fitted per pointing (gridpoint) for each channel and polarisation. One mean for the whole night does not work: the |dV| noise level drifts ~13% over the night, and the undifferenced EAVILS amplitude ramps within each pointing and steps between pointings. Per obs shows the original z, normalised within each 2-minute observation.
Night timeline: all methods
One row per method, all on the same UTC axis. Z-score methods show the channel-mean z (unflagged channels); flaggers show the channel-mean fraction of baselines flagged; bayesian-rfi shows P(RFI). Y axes are clipped so bursts don't flatten the rest (z to ±6, flaggers to their 99.5th percentile); double-click a row to autoscale. Hover for values; drag to zoom (all rows follow).
Waterfall
Occupancy spectrum
Night-mean fraction of cross baselines each flagger flagged, per fine channel (input-flagged samples left out). This is the check for coarse-channel structure. Hover for values. CASA rflag and tfcrop have the same shape in every coarse channel, at different levels. They were run on one 32-channel coarse channel at a time, so their own edge effects repeat at the same fine-channel index in every band. These are rflag's sliding-window U-shape and tfcrop's bump at channels 4–5 from its piecewise polynomial fit. Neither is a feature of the data.
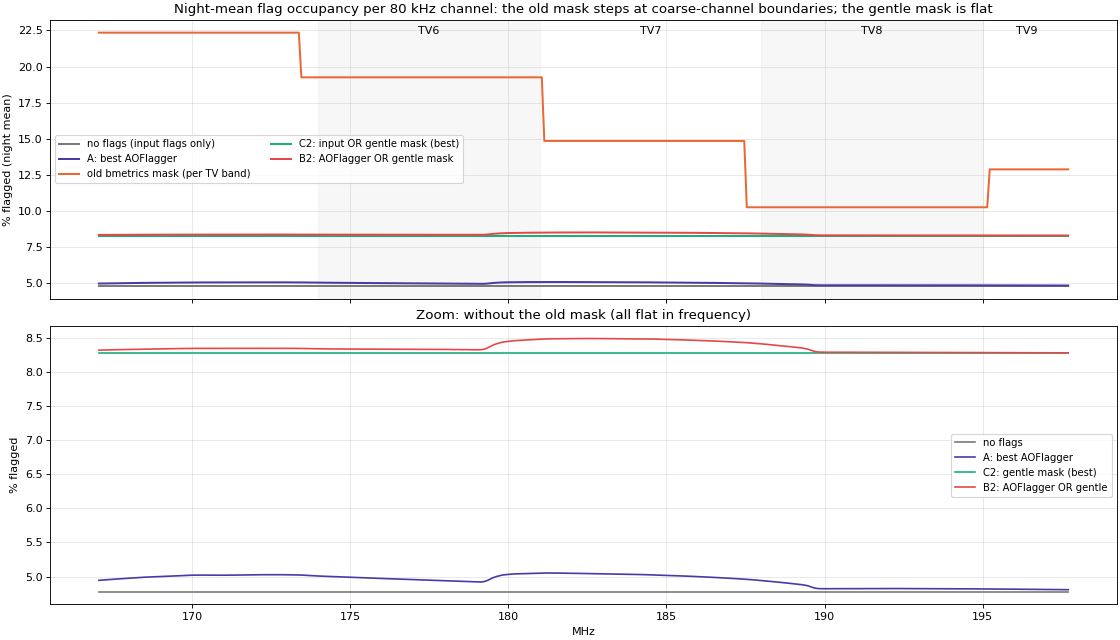
Flag rate per fine channel for the methods that flag whole cells (time × channel) instead of single baselines: the percentage of the night's (input-unflagged) samples each one flags. The gentle bmetrics mask flags whole timesteps across the band, so it is flat by construction.
Per-observation flagged fraction
Rows are methods, columns are observations (pointing in the hover). Darker means more of that observation is flagged.
Birli bmetrics vs SSINS
Birli's bmetrics reimplements SSINS. Left: Birli's own SSINS z (FITS output: all baselines incl. autos,
no corrections, ignores per-baseline flags) against pyuvdata SSINS z on the same raw data. Middle: Birli's SSINS-compatible INS
(--ins --ins-corrections, cross only) re-scored by SSINS. Right: ratio of the time-mean INS amplitude per channel (pyuvdata / Birli INS).
Points are a random subsample of (time, channel) cells; edge channels and NaNs dropped.
Agreement between methods
Jaccard index (|A and B| / |A or B|) of flagged (time, channel) cells on the differenced time grid (a flagger's sample pair counts as flagged if either sample is). Cells flagged on input (Birli's first-timestep flag, flagged tiles leave the rest) are left out of every count on this page. 1 = identical flags, 0 = no overlap.
What each flagger removes
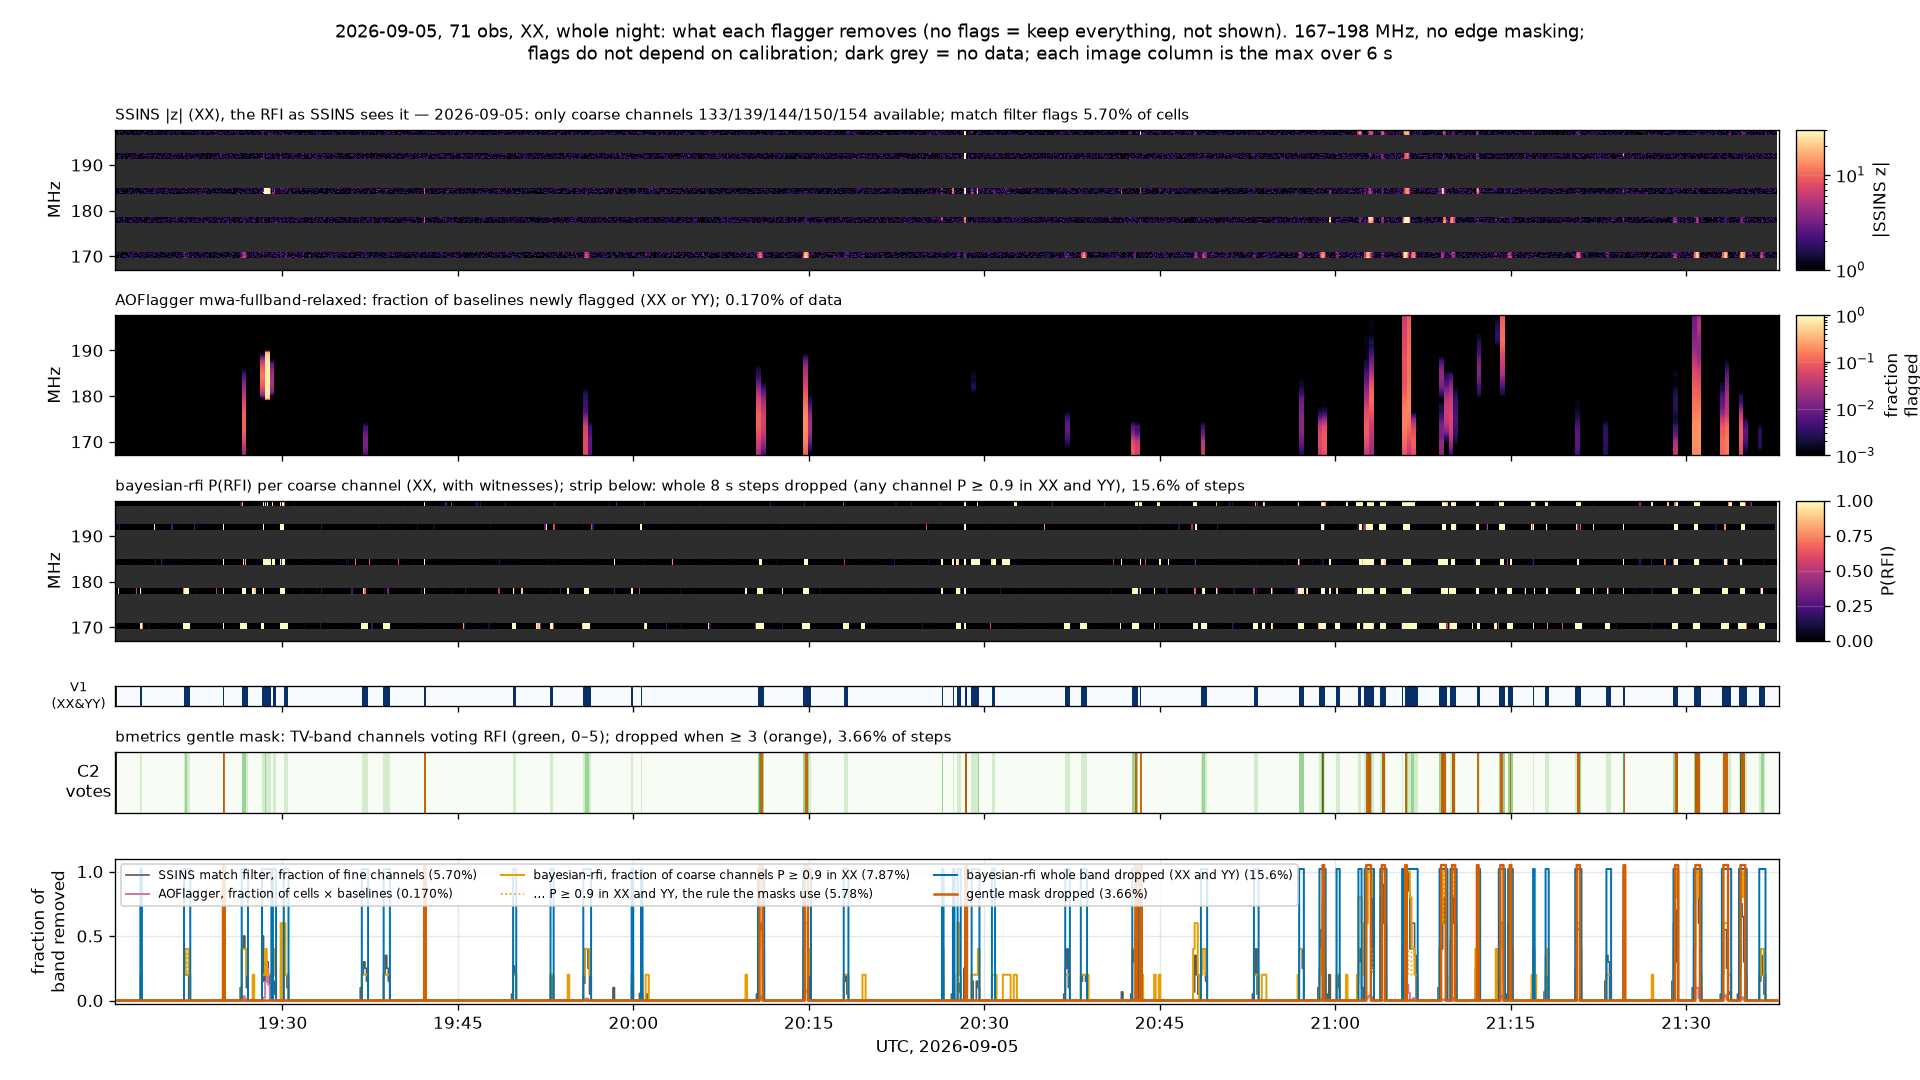
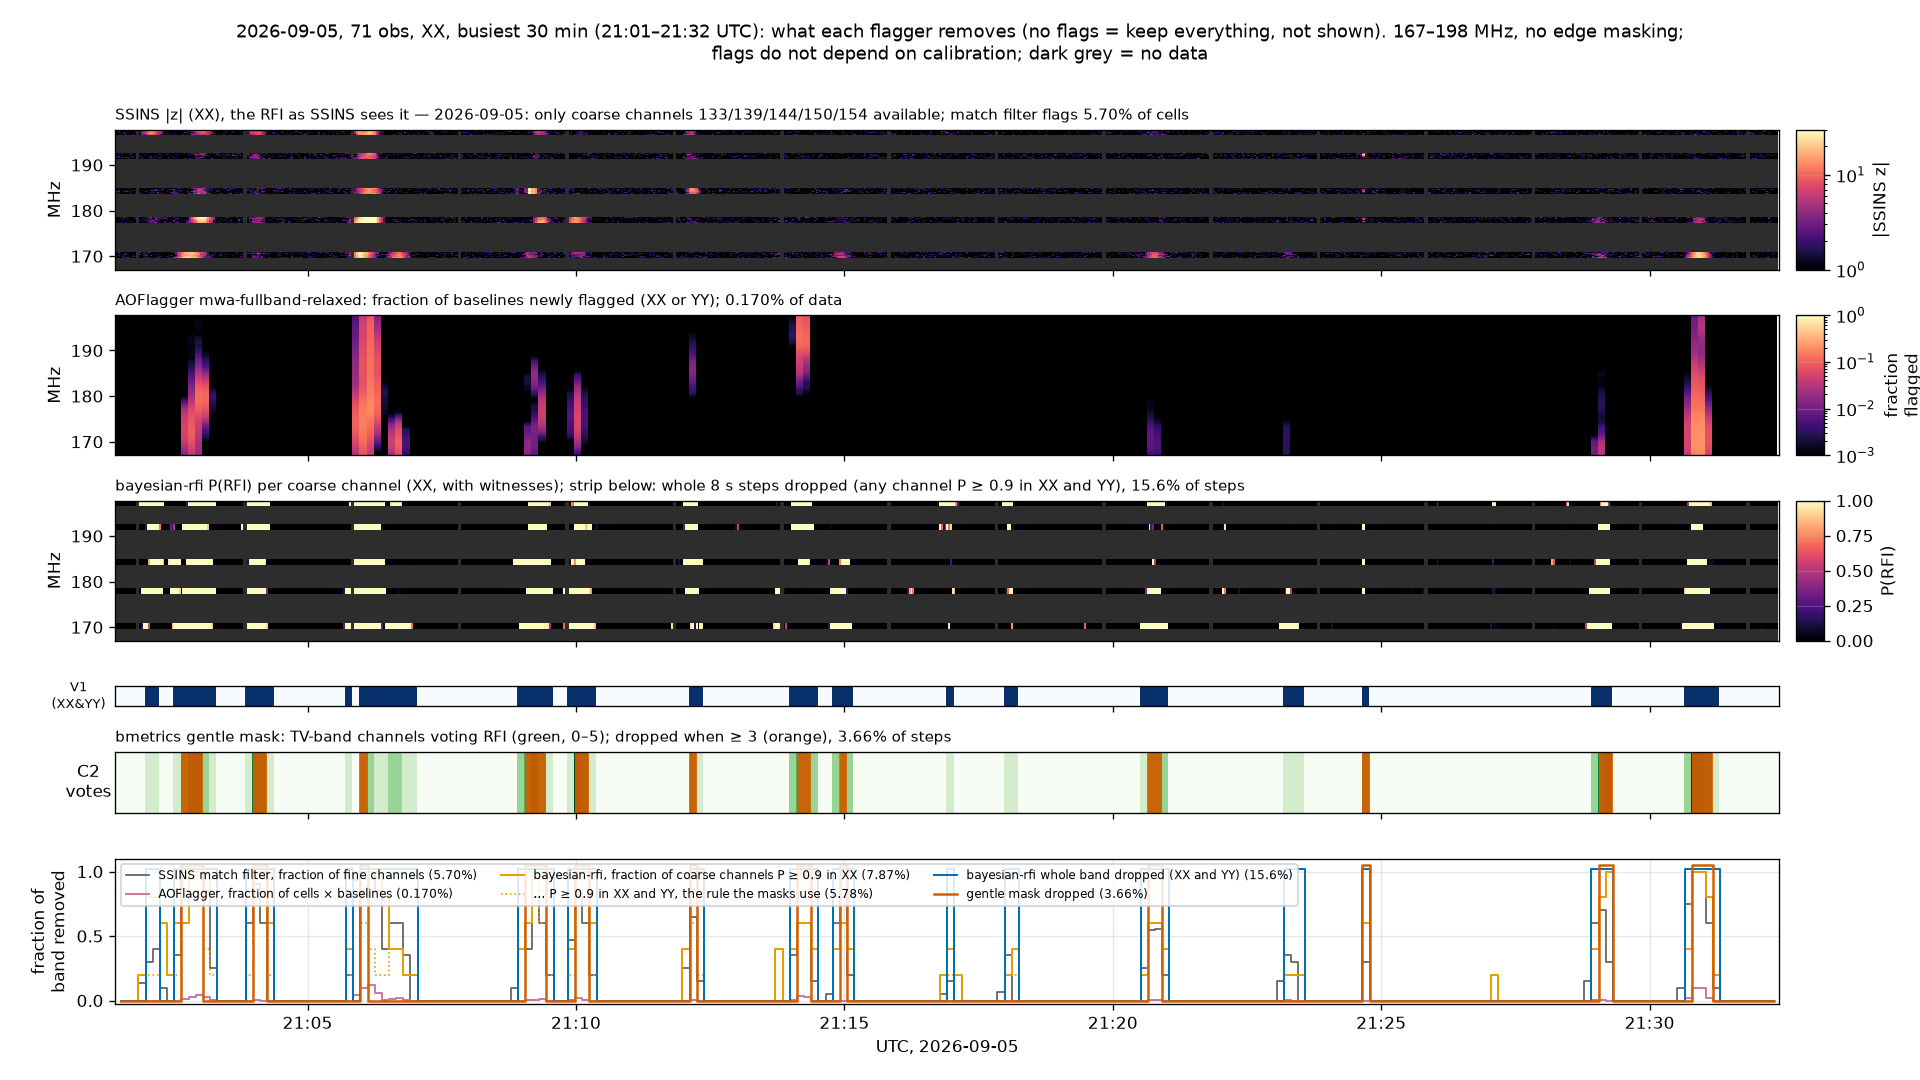
Time on x (true UTC), 167–198 MHz on y. Panels: SSINS |z|; AOFlagger mwa-fullband-relaxed new flags; bayesian-rfi (Ducharme, Li, Wilensky & Liu (2026)) P(RFI) per coarse channel with the whole-band steps it drops (needs XX and YY); the gentle mask's TV-channel votes; and the fraction of the band each removes per 8 s step, all on one time axis. Flags do not depend on calibration. Script: wf_flaggers.py.
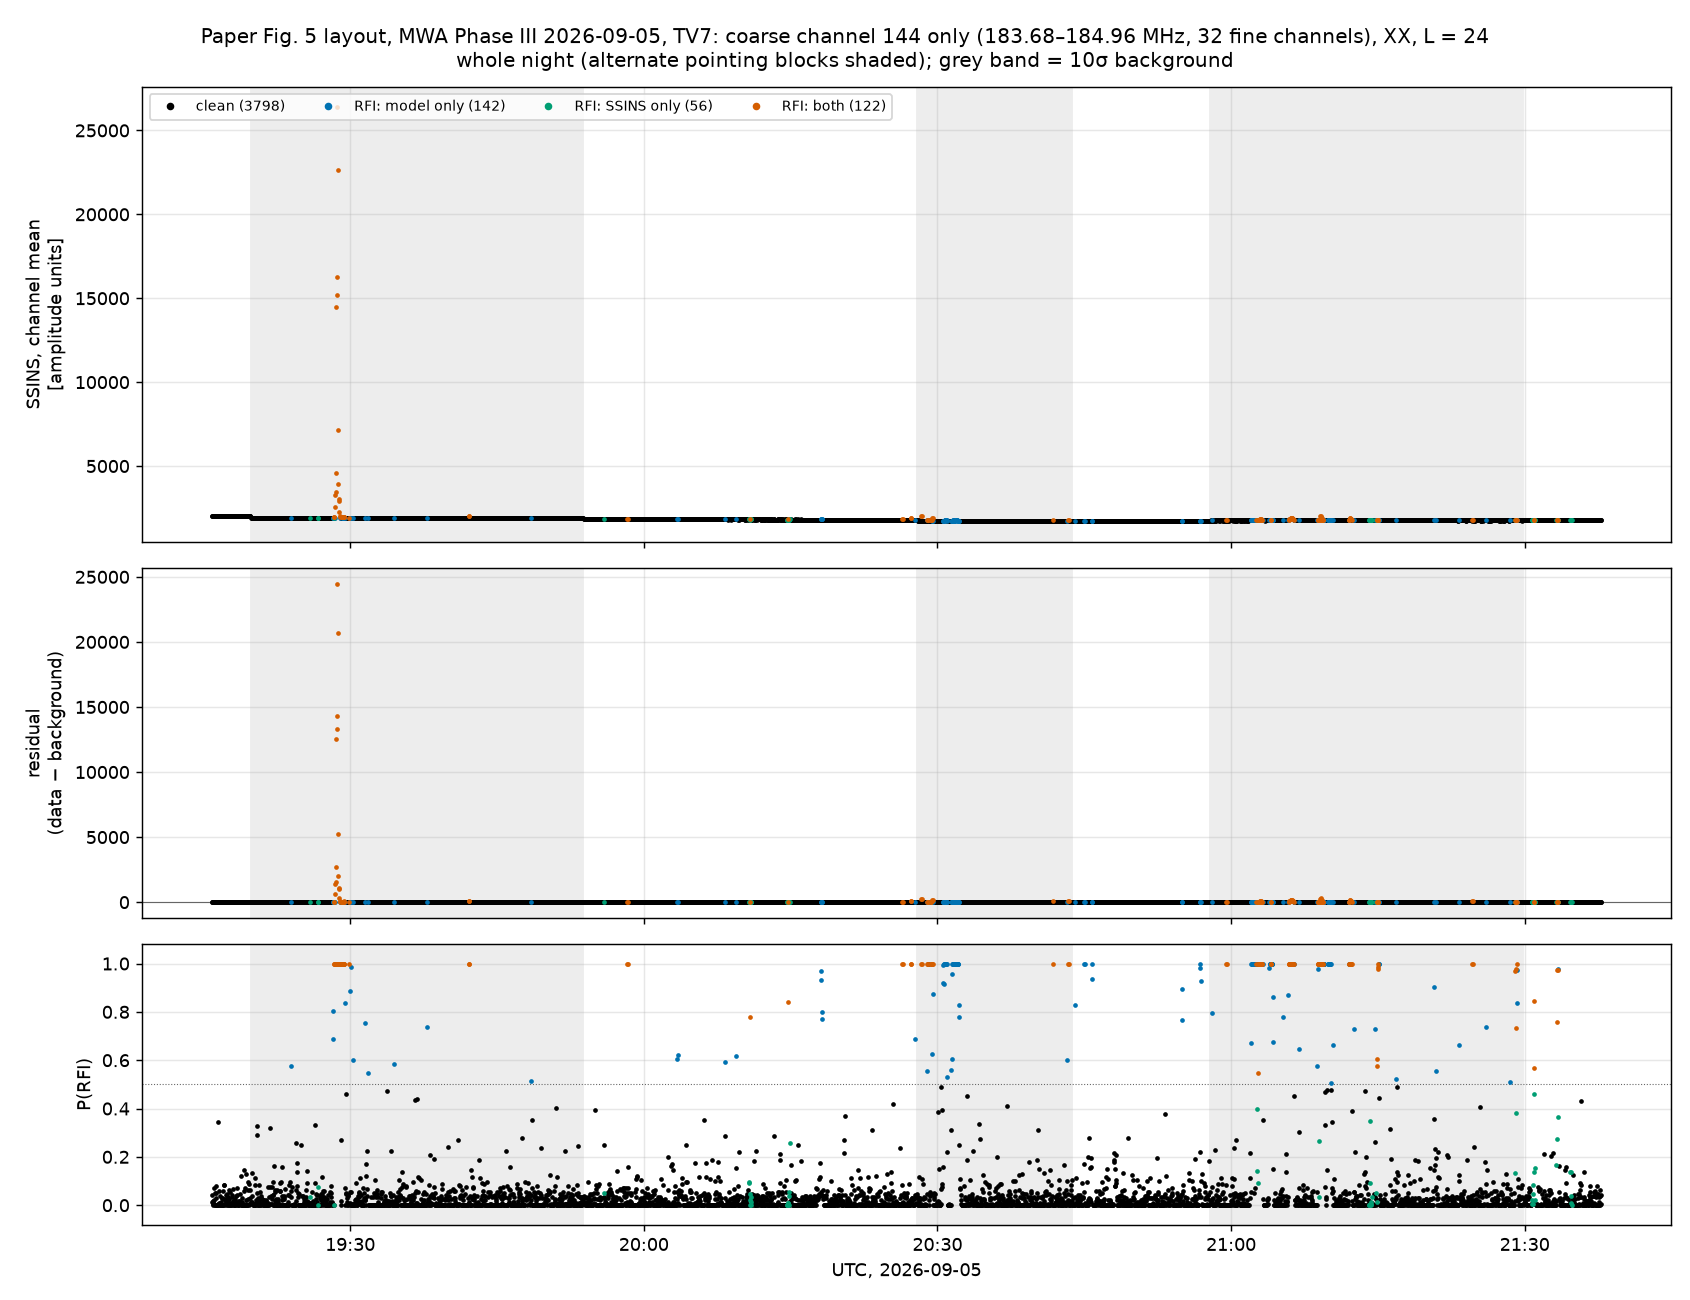
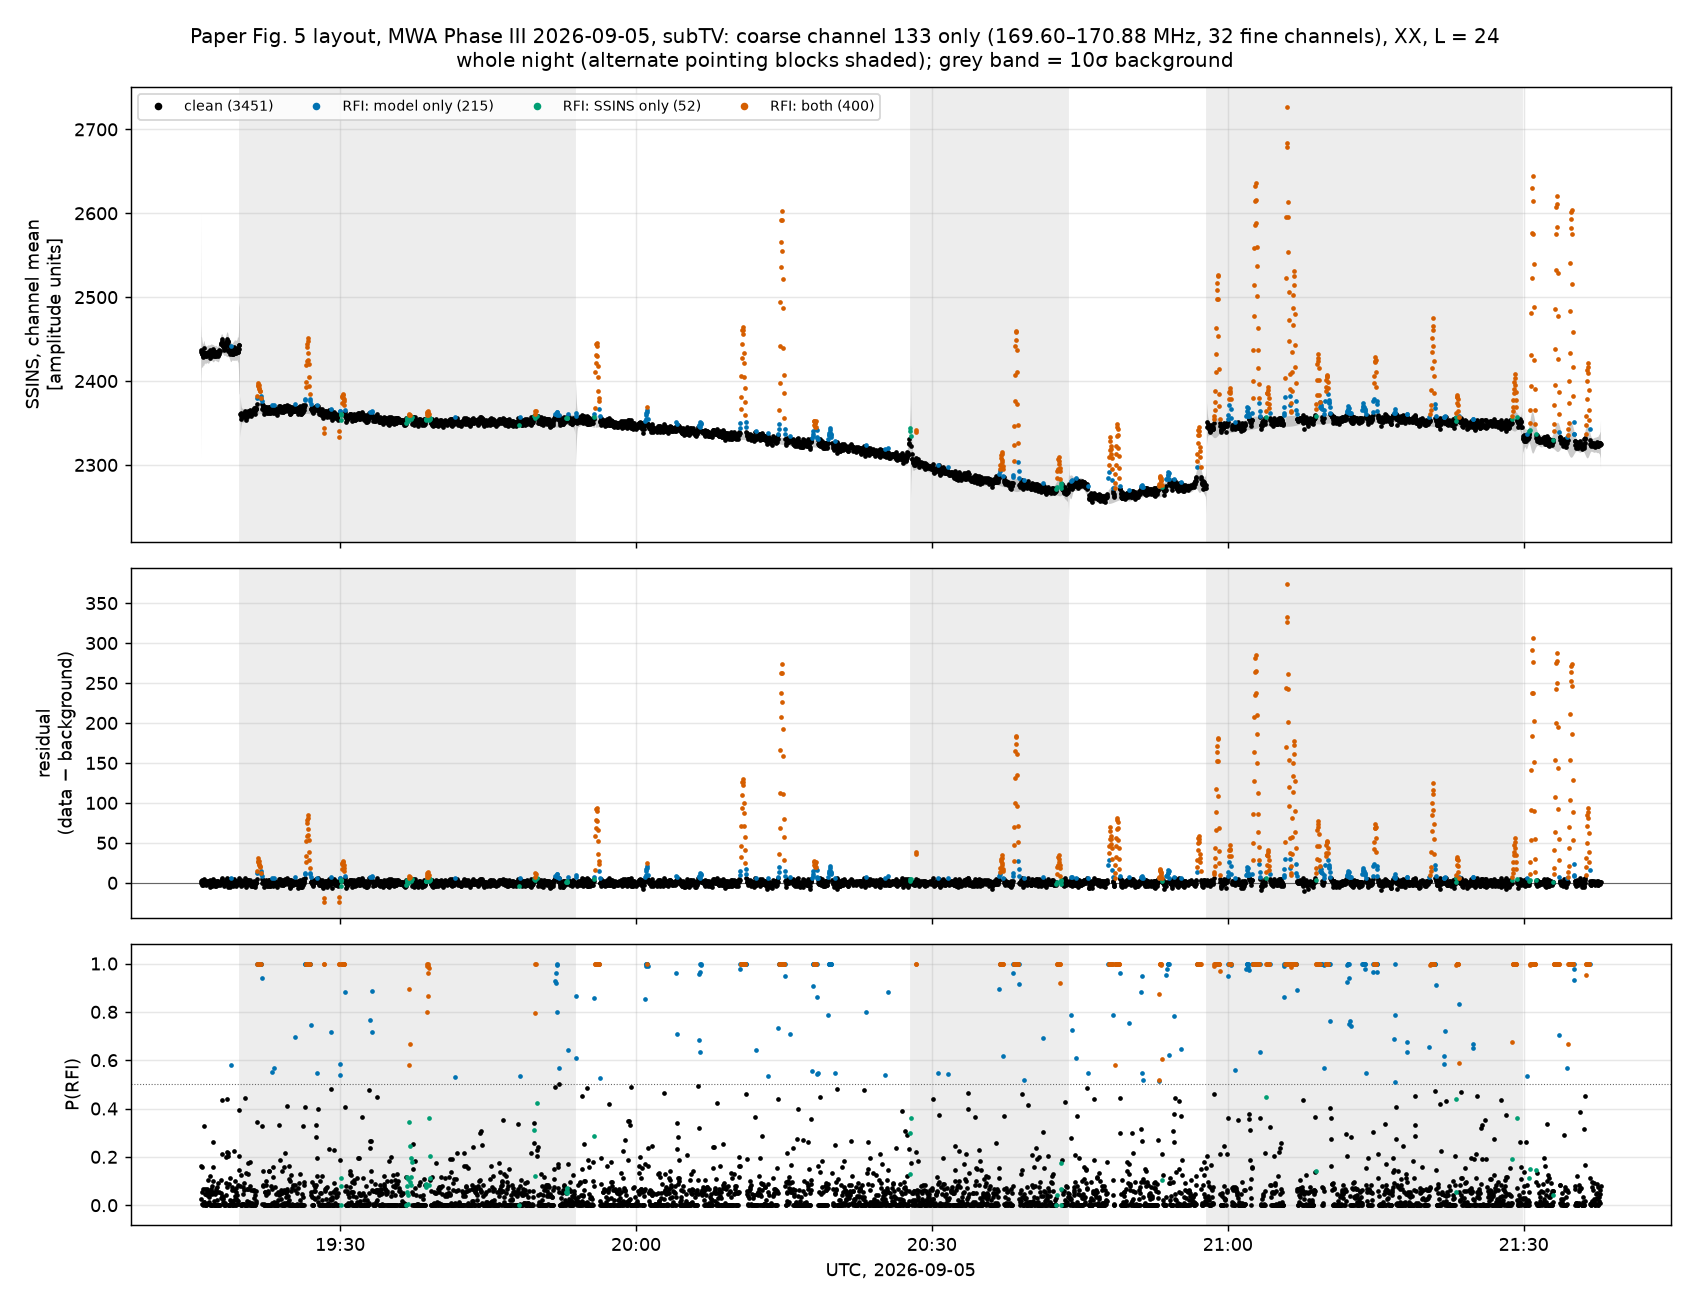
bayesian-rfi fit (paper Fig. 5 layout)
Power spectra
Four-way flagger comparison (added 2026-11-12). Witnesses (EAVILS, AOFlagger 1cc, CASA rflag, tfcrop as extra evidence in the bayesian-rfi fit) make no measurable difference to the power spectrum: the SSINS-only masks are within ±5%. Details in the gist.
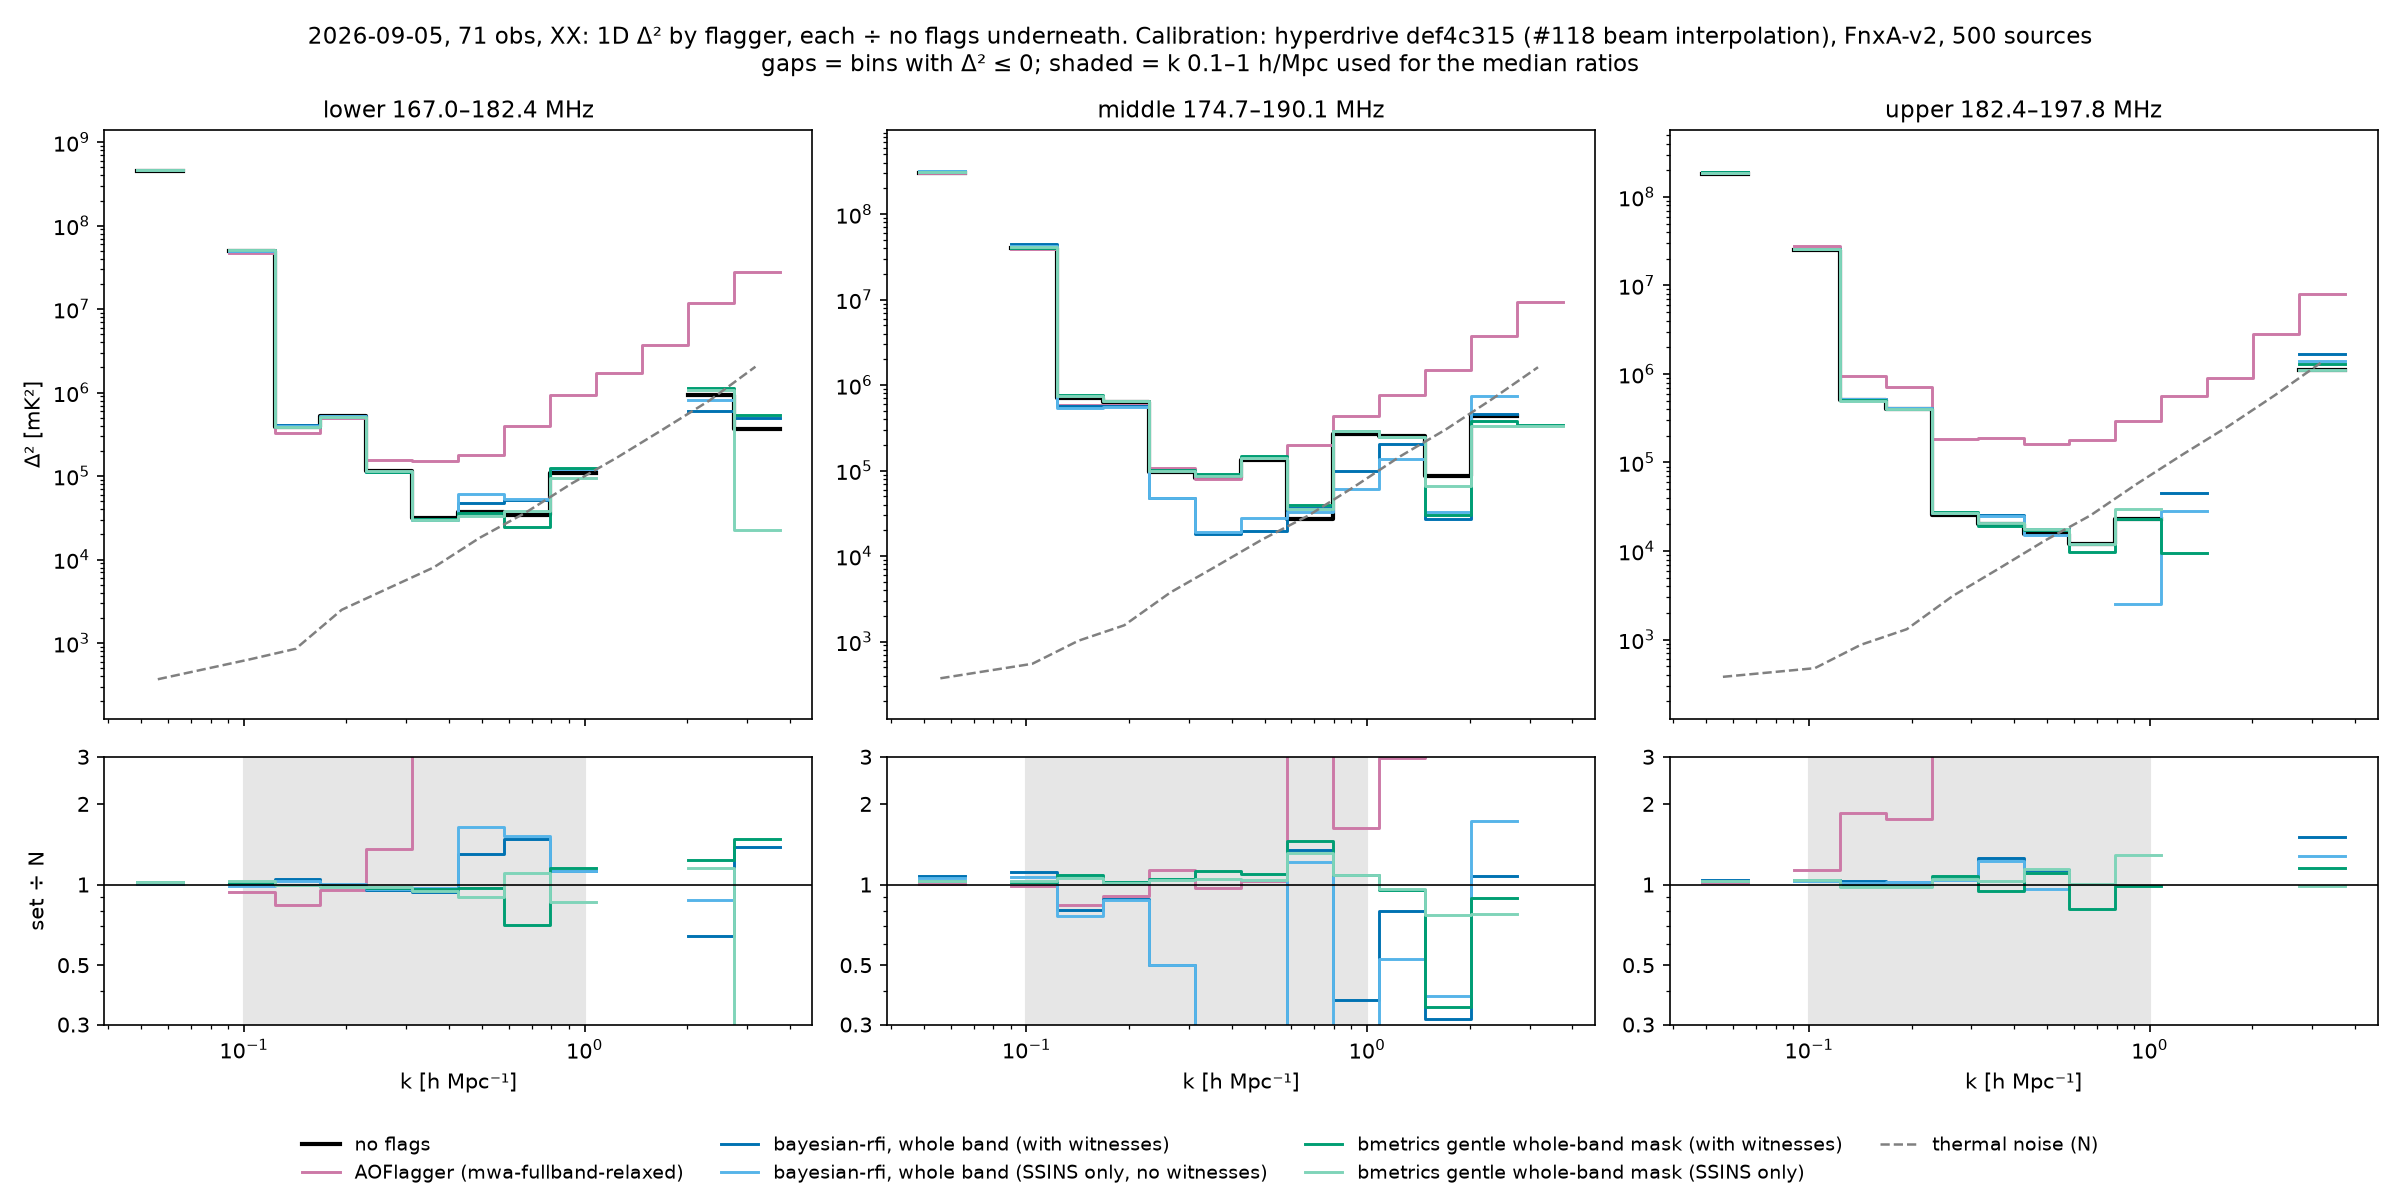
Redone 2026-11-10 with hyperdrive def4c315 (#118, FEE beam interpolated in frequency) and the Fornax A v2 sky model, 500 sources. CHIPS cylindrical (2D) and spherical (1D Δ²) power spectra of the whole night (71 obs), DI-calibrated, with no foreground subtraction.
Three half-bands of 192 × 80 kHz: lower 167.0–182.4, middle 174.7–190.1, upper 182.4–197.8 MHz.
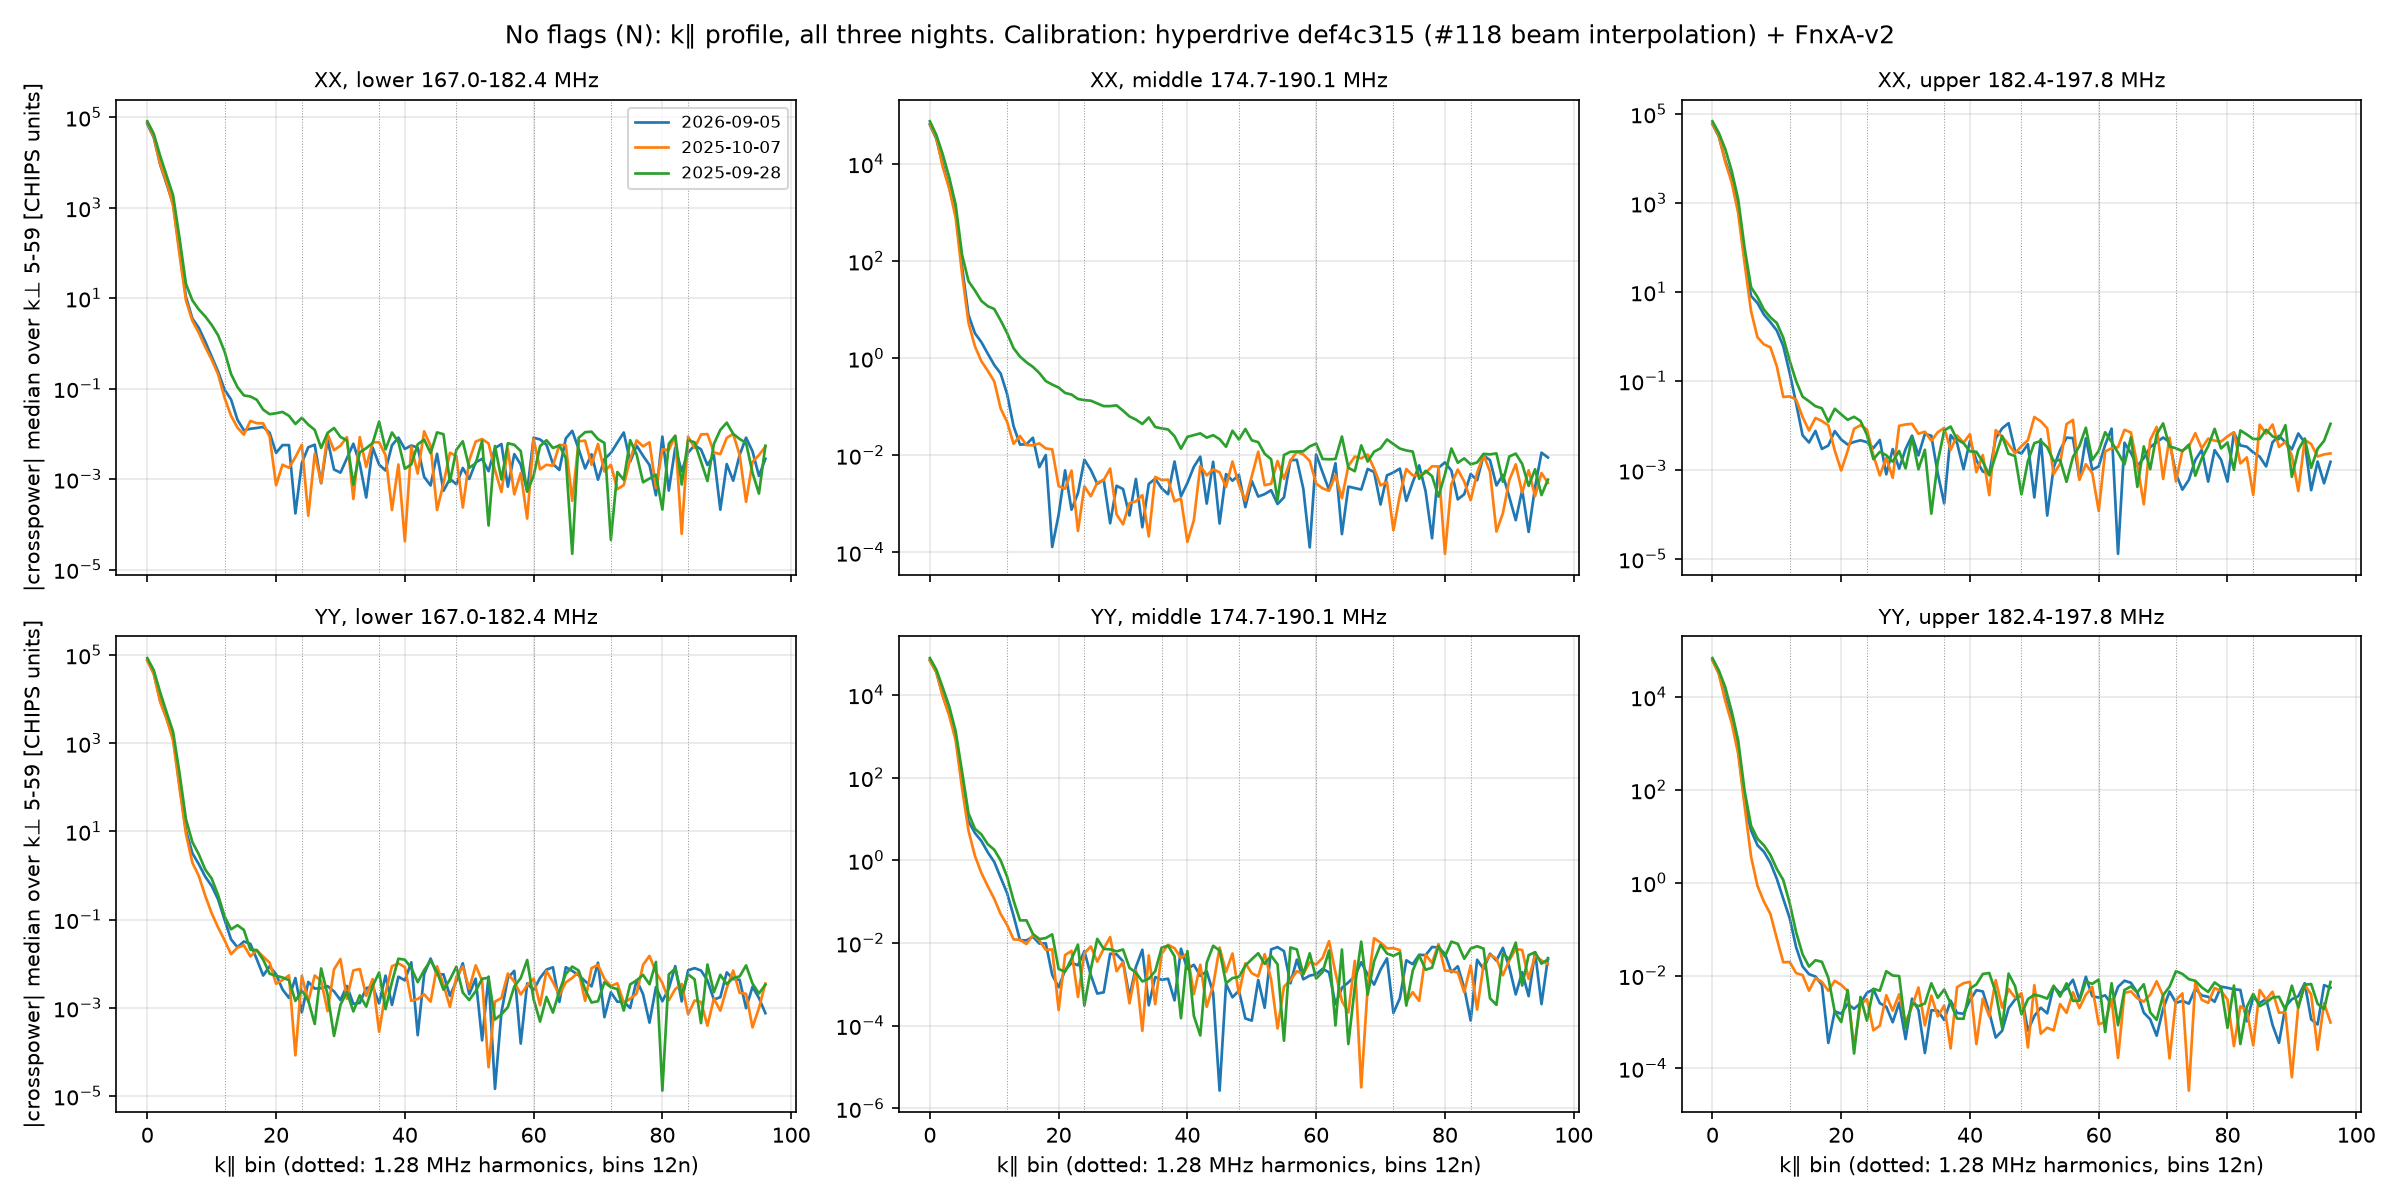
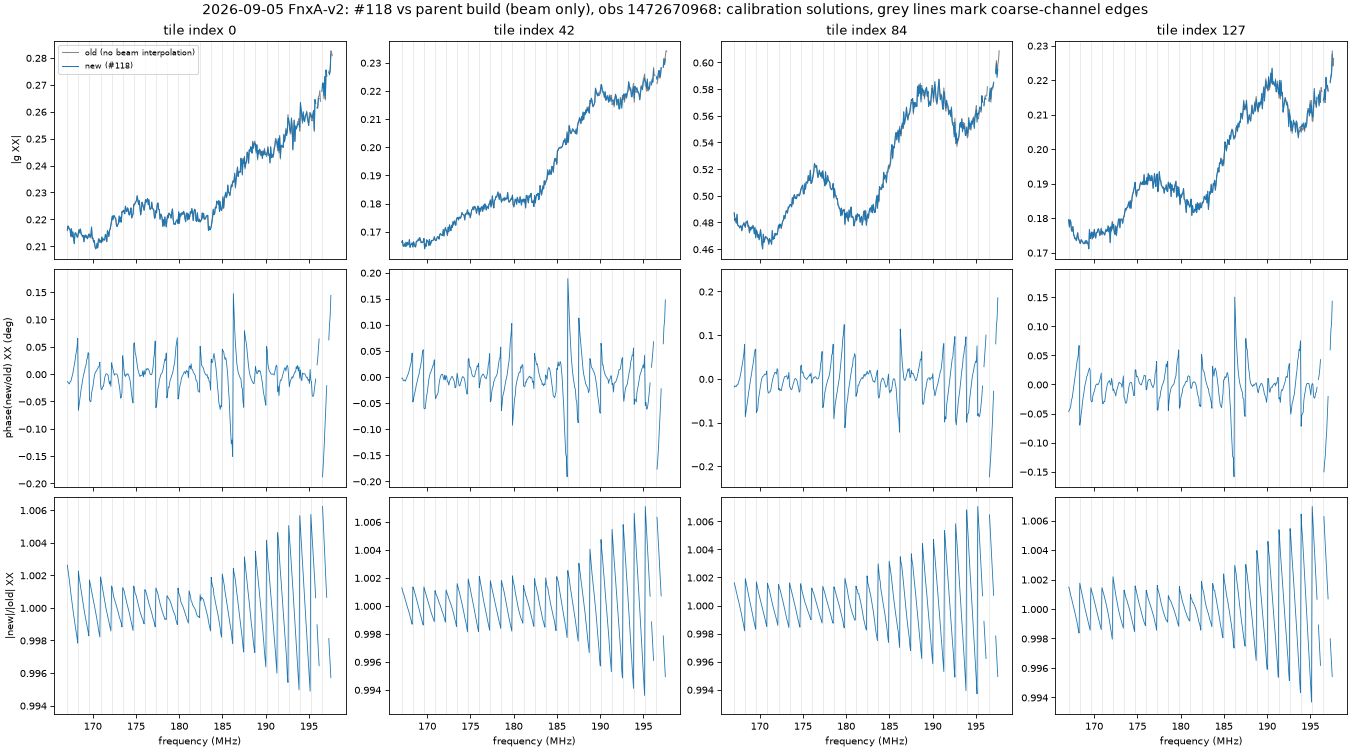
The k∥ ≈ 0.45 h/Mpc line (1/1.28 MHz) is gone. With no flags its excess over neighbouring k∥ bins falls from ×3.4–6.1 to ×0.2–0.5 in every band and polarisation, and the higher harmonics fall by one to two orders of magnitude. This page previously called it residual coarse-channel passband ripple in the data. That was wrong: calibration held the beam response constant across each 1.28 MHz coarse channel, so the solutions stepped at every coarse-channel edge. These spectra change both the beam and the sky model, so overall power is about ×0.75 (the Fornax A v2 flux scale); the effect of the beam alone on the solutions is shown below.
- No flags and the gentle bmetrics mask agree to about 15% at k ≲ 0.5 h/Mpc; above that both are near the noise.
- AOFlagger (mwa-fullband-relaxed) flags only ~0.17% of cells but still raises Δ² at k ≳ 0.4 h/Mpc: ×1–15 in most bins, up to ×40–86 in noise-dominated bins.
- The old per-TV-band mask (16% of cells) is far worse: ×30–5000 at k ≳ 0.26 h/Mpc, because it steps at coarse-channel boundaries.
- V1 (whole band flagged at a timestep if any channel is RFI) matches no flags at k ≲ 0.2 h/Mpc; in the middle band at k ≈ 0.26–0.5 h/Mpc it is ×0.15–0.6 of no flags.
- V2 (per-channel RFI, inpainted with a line in frequency after calibration) has 2D window medians ×0.79–0.95 of no flags and 1D Δ² ×0.2–0.5 in the middle band at k ≈ 0.26–0.5 h/Mpc. In the lower band XX it is ×1.2–1.3 above no flags at k ≈ 0.36–0.49 h/Mpc, and a few noise-level bins are also above no flags, so it is not strictly better everywhere.
Earlier ratio maps on this page used a scrambled CHIPS axis order; the maps and numbers here use the corrected reader, and the 2D and 1D figures have always used the correct one. Details, all three nights and the full pass/fail table: gist, earlier analysis. The previous version of this page is in old_pre_bfi/.
1D Δ² of the best flaggers on one set of axes per half-band, each ÷ no flags underneath: no flags, V2 inpaint, C2 gentle whole-band mask, V1 time-only, AOFlagger, thermal noise. Calibration: hyperdrive def4c315 (#118 beam interpolation), FnxA-v2, 500 sources. V2 is best or tied in every band and polarisation; median ratio to no flags over k = 0.1–1 h/Mpc is ×0.44–1.01 for V2 and ×1.0–8.3 for AOFlagger. Script and all nights: gist.
2D power spectra. Rows: flag sets (no flags first). Columns: lower, middle, upper band.
1D Δ²: no flags vs each flag set.
1D Δ², no flags: old (no beam interpolation, pumav3) vs new (#118, Fornax A v2).
Coarse-channel comb check, no flags, all three nights: k∥ profile (median over k⊥ bins 5–59); dotted lines are the 1.28 MHz harmonics (bins 12n). Calibration: hyperdrive def4c315 (#118 beam interpolation), FnxA-v2. The bin-12 excess over neighbouring bins is ≤ ×0.58 everywhere and the higher harmonics are at the level of non-harmonic bins.
Beam only: calibration solutions on one observation (1472670968) with the Fornax A v2 list, with and without #118. The new ÷ old ratio is a sawtooth that resets at every coarse-channel edge (grey lines).
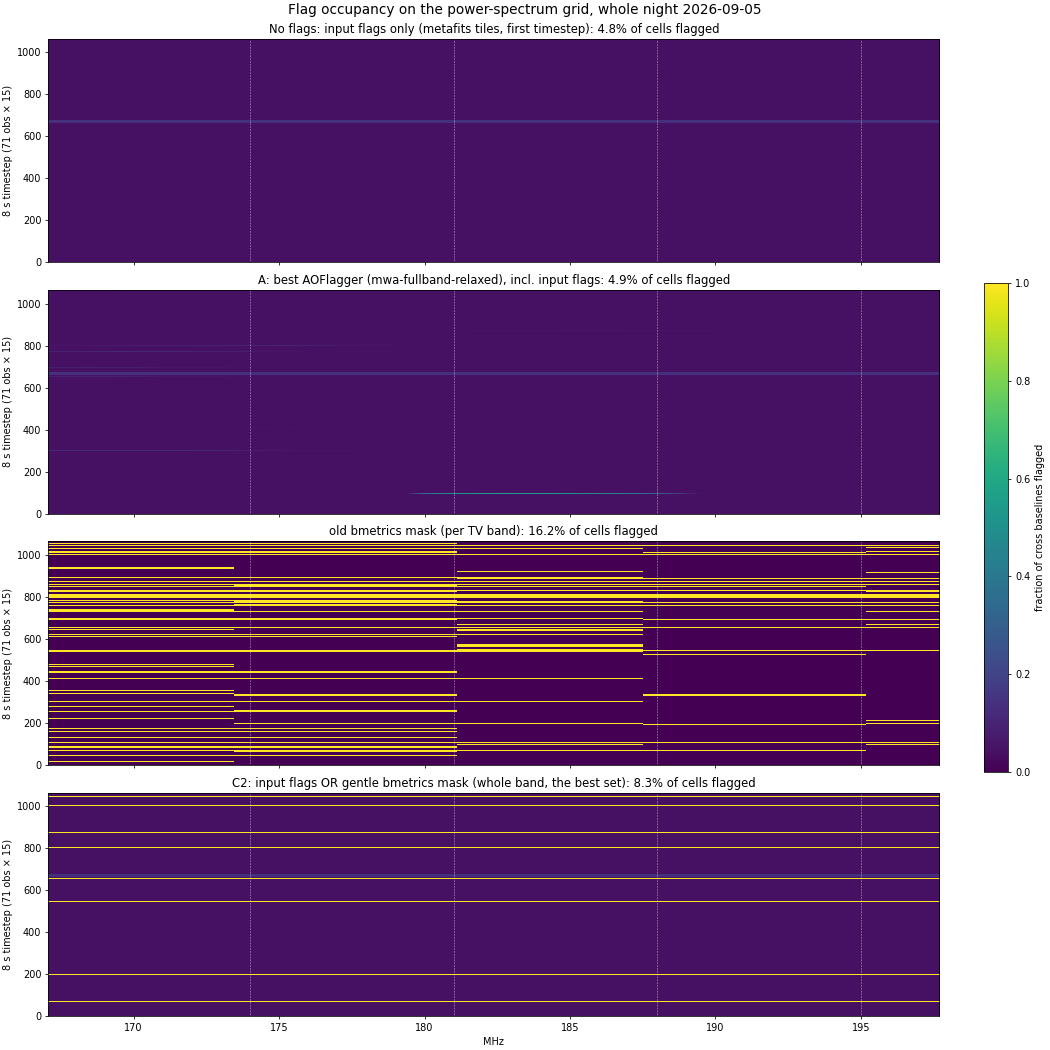
Power ratios to no flags, and flag occupancy on the power-spectrum grid
Ratio rows: flag sets ÷ no flags, corrected CHIPS reader, with the k∥ profile of each ratio in the last row. The old mask (16% of cells) steps at coarse-channel boundaries and leaks power; the gentle whole-band mask (3.7% of 8 s timesteps) is flat in frequency.
Reproduce the gentle bmetrics mask
The gentle mask flags whole 8 s timesteps across the full band. It does that only when a witness-informed bayesian-rfi fit is confident (P(RFI) ≥ 0.9 in XX and YY), the RFI persists (≥ 2 of the four 2 s samples), and it is broadband (≥ 3 of 5 TV bands agree). All scripts are in the gist. Paths below are relative to a work directory with raw/<obsid>/ (metafits plus raw coarse-channel FITS) and obsids.txt.
- Choose one coarse channel per TV band (the mask is fitted per band, then combined). This night: 133 (sub-TV), 139 (TV6), 144 (TV7), 150 (TV8), 154 (TV9). Keep the raw
_ch<NNN>_000.fitsfor those channels, e.g. withKEEP="133 154"/CHANSinfetch_ps.sh. - Per-obs RFI metrics for each of those channels (native 2 s / 40 kHz, no edge or DC flags, because MWAX uses an oversampled PFB):
for c in 133 139 144 150 154; do for o in $(cat obsids.txt); do worker.sh $o $c; done; done
Each run ofworker.shruns Birli to an MS (--no-rfi --flag-edge-chans 0 --no-flag-dc), then hyperdrivebmetrics(EAVILS + INS), pyuvdata SSINS (ssins_run.py), AOFlagger (incl.mwa-1cc-sensitive.lua), and CASA rflag/tfcrop (casa_flag.py). Outputs go tonight/obs/<obsid>/ch<c>/. - Assemble each channel's night file (UVFlag .h5 with every method; the EAVILS z is renormalised per pointing):
for c in 133 139 144 150 154; do python assemble.py night $c; done
- Witness inputs. These are the pyuvdata SSINS INS series plus four normalised witnesses (EAVILS, AOFlagger mwa-1cc-sensitive, rflag, tfcrop). From each witness, remove the within-obs profile and a per-obs robust linear trend, then divide by the per-obs 1.4826·MAD:
for c in 133 139 144 150 154; do python brfi_witness_data.py $c; done
- Fit the "ultimate" model: bayesian-rfi (d3v-null fork
feat/mwax-night-stack,mixture_model.py), one Legendre background per pointing (L = 12) and every witness sharing the clean/RFI label. Use 2000 warm-up + 1500 samples × 8 chains, and check R-hat ≤ 1.05:for c in 133 139 144 150 154; do for p in xx yy; do python brfi_witness_fit.py $c $p ultimate 2000 1500 8; done; done
- Build the masks: one
<obsid>_mask.npzper obs, shape (15 × 8 s, 24 coarse channels), identical across channels:python ps_masks_chill.py masks2/
This night flagged 3.7% of 8 s timesteps. - Apply the masks. To the averaged no-AOFlagger MS:
mask_ms.py <ms> masks2/<obsid>_mask.npz(ORs into FLAG). To hyperdrive uvfits for CHIPS:apply_mask.py <uvfits> <mask.npz>(negates the weights). For the full-night MS seenight_ms.sh. The power spectra come fromgrid_group.sh N|A|C2thencombine_lssa.shon Setonix.
Use whole-band timestep flags (step 6). A per-TV-band version of the same mask flagged 16% of cells in coarse-channel-aligned blocks, and raised the EoR-window power 1.4–2.9× through delay-space leakage.
Walltime
Which AOFlagger strategy? All six strategies compared (only the best, mwa-fullband-relaxed, is shown elsewhere on the page)
Update 2026-11-04: the strategy shown elsewhere on the page is now mwa-fullband-relaxed. It was chosen from 4 full-band candidates run by Birli on all 24 coarse channels at once, scored against the witness bayesian-rfi labels. It flags little: about 0.17% of cells over the input flags across the whole night. Its occupancy comes from the 8 s / 80 kHz averaged MS. The single-coarse-channel strategies below were run per channel at 2 s / 40 kHz, and the text after this paragraph compares only those.
For each strategy and occupancy threshold (a cell counts as flagged when at least that fraction of cross baselines are flagged), the Jaccard index of its flags against the SSINS match-filter flags and against bayesian-rfi (P ≥ 0.5), for the selected channel and polarisation. Bold = best threshold per strategy.
Over all three channels and XX/YY/XY, mwa-1cc-sensitive agrees best with the two references by a wide margin: mean Jaccard 0.55 with SSINS and 0.33 with bayesian-rfi at a 5% threshold, a combined 0.44. The others score at most 0.27, at a 1% threshold: generic-default 0.274, mwa-default 0.272, mwa-1cc 0.251, stokesI 0.159, perpol 0.097. Below 5%, mwa-1cc-sensitive drops off because it flags a few baselines almost everywhere (~4% background). The four 1cc strategies were re-run on 2026-10-26 without the stock 3× time downsampling. That downsampling, combined with Birli's flagged first timestep, over-flagged the first two good samples of every observation about 2× (stock mwa-default still does).
bayesian-rfi posterior
Methods
Read from each method group's attributes in the h5 file.