MWA EoR1-high night 2025-10-07: power spectra by RFI flagging
59 × 2-min MWAX observations 1443896016–1443904296, 167–198 MHz. Every power spectrum here is calibrated with hyperdrive main def4c315
(mwa_hyperdrive #118, FEE beam interpolated in frequency) and the FnxA-v2 500-source list; CHIPS half-bands lower 167.0–182.4, middle 174.7–190.1,
upper 182.4–197.8 MHz. Flag sets: N no flags, A AOFlagger mwa-fullband-relaxed, C2 gentle whole-band mask, CC gentle per-coarse-channel mask,
V1 whole band if any channel is RFI, V2 per-channel bayesian-rfi decisions inpainted by a line in frequency.
Full write-up, all three nights and scripts: gist.
Earlier figures made without beam interpolation (they show the 1.28 MHz coarse-channel comb; do not use): old_pre_bfi/.
RFI occupancy
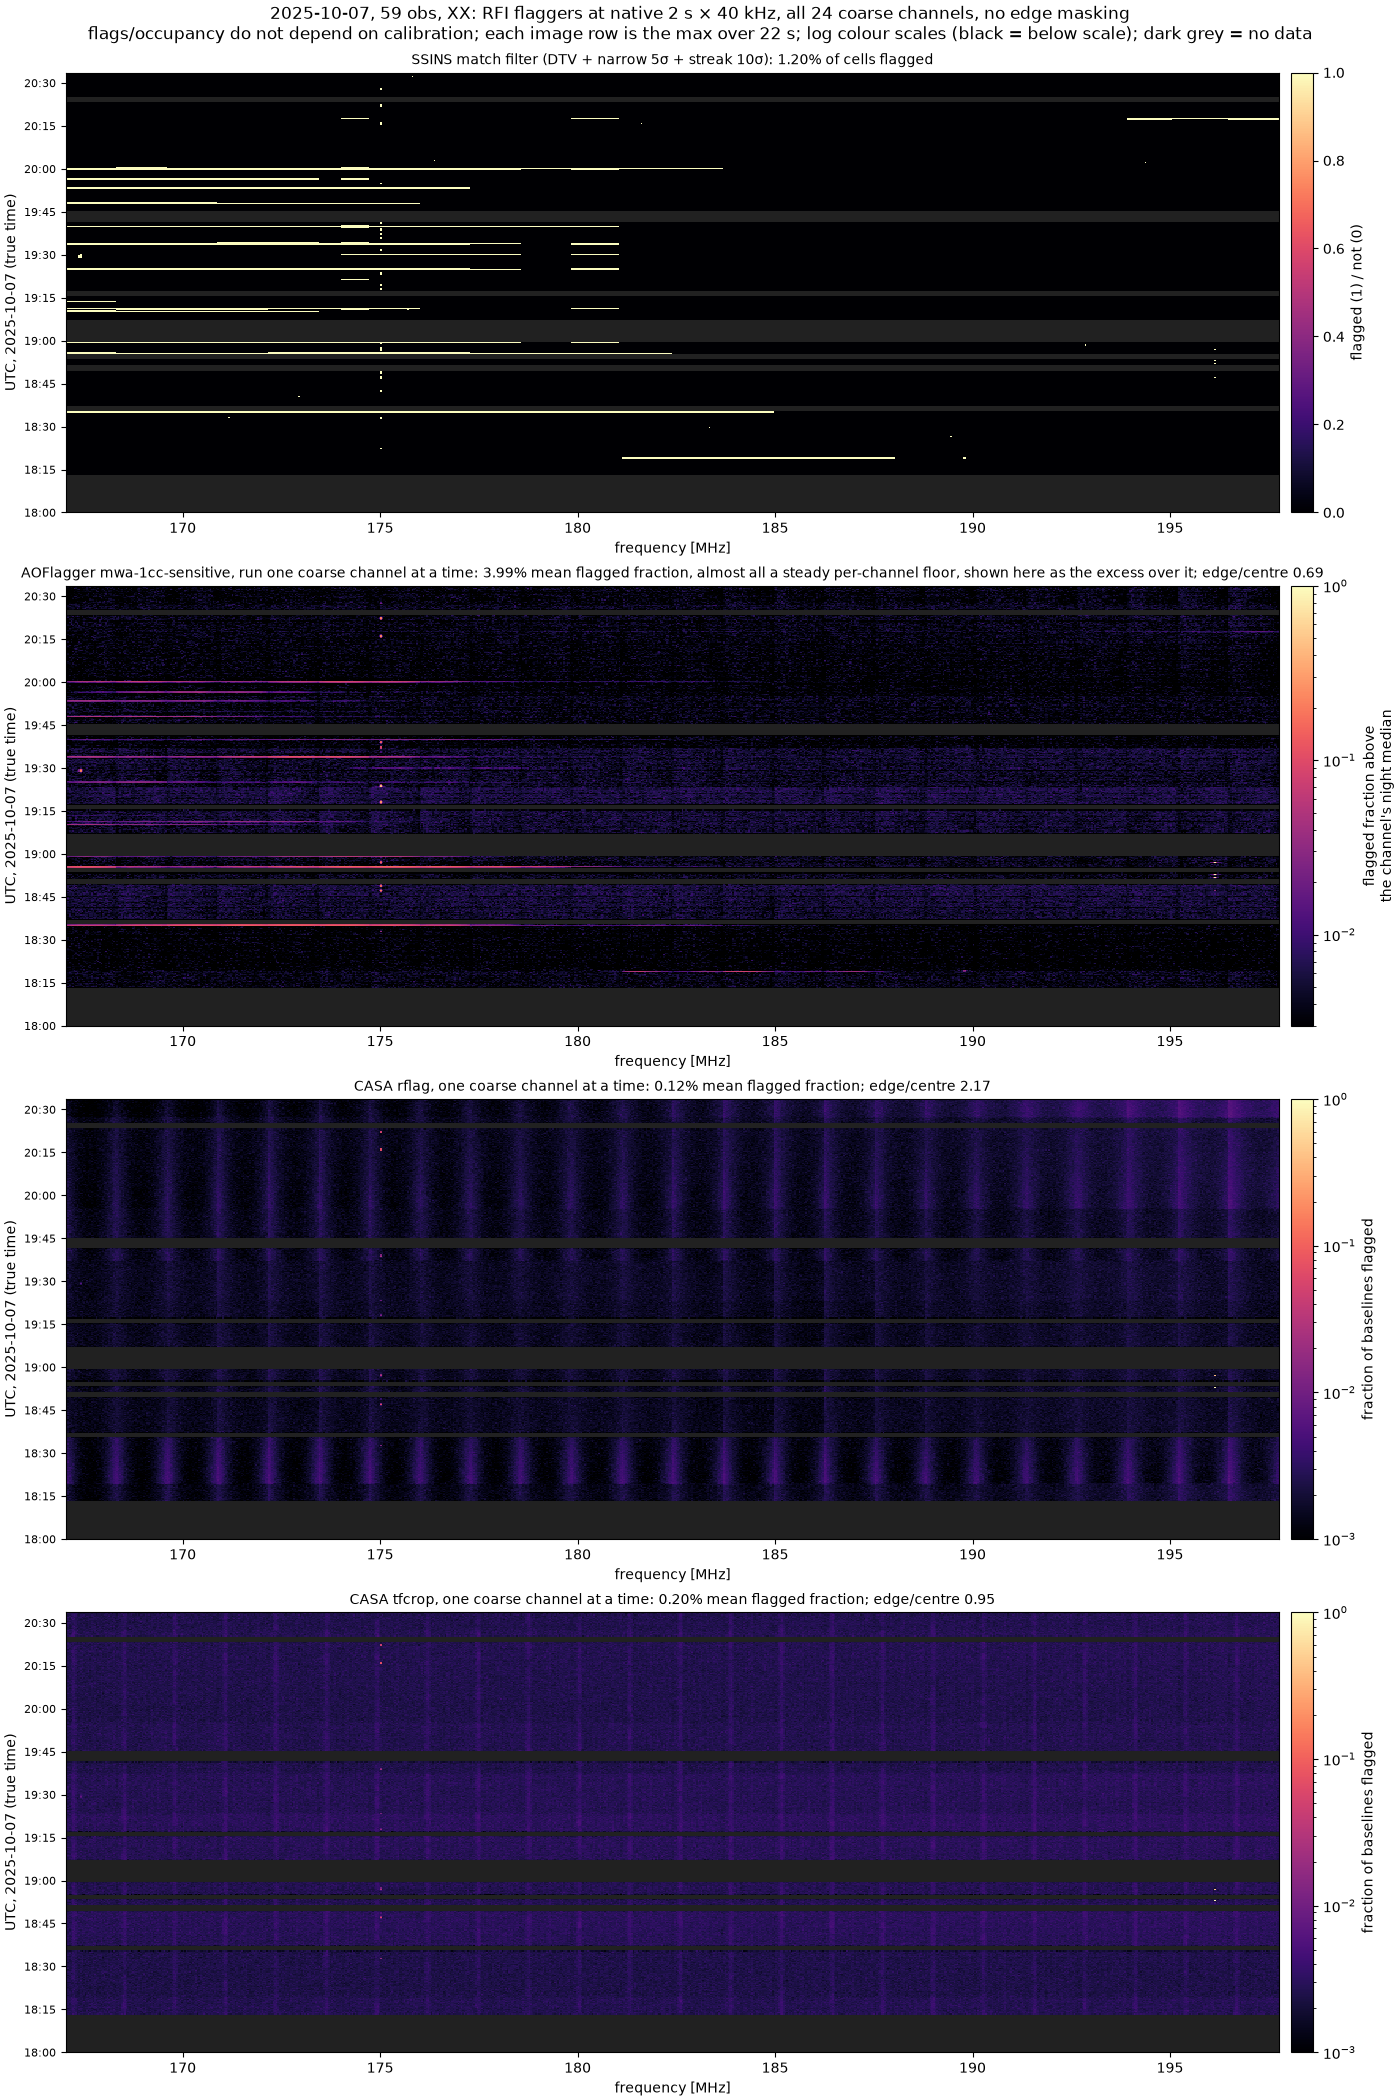
Flags and RFI metrics for the whole night (59 obs, 18:13–20:33 UTC), full band 167.04–197.76 MHz, all 24 coarse channels at native resolution
with no coarse-channel edge masking (Phase III, oversampled PFB). Time axis: true UTC; dark grey marks no data (missing observations); each image row is the maximum over ~22 s (24 s for the 8 s grid). Flags and occupancy do
not depend on calibration. Script: occ_1007.py; write-up in the gist notes.
Per-coarse-channel flaggers at 2 s × 40 kHz, XX:
SSINS match filter 1.20% of cells (excluding the first difference of each obs, which involves the input-flagged first sample);
AOFlagger mwa-1cc-sensitive 3.99% mean flagged fraction, almost all a steady per-channel floor, so the panel shows the excess over each channel's night median;
CASA rflag 0.12%; tfcrop 0.20%. SSINS and AOFlagger flag both polarisations together. YY (rflag 0.19%, tfcrop 0.19%).
The vertical banding with the 1.28 MHz period comes from these flaggers running on one coarse channel (32 channels) at a time, not from the data:
night-mean flag fraction at fine channels 0 and 31 divided by channels 12–19 is 0.69 for AOFlagger (fewer flags at the edges), 2.17 (XX) / 2.02 (YY) for rflag
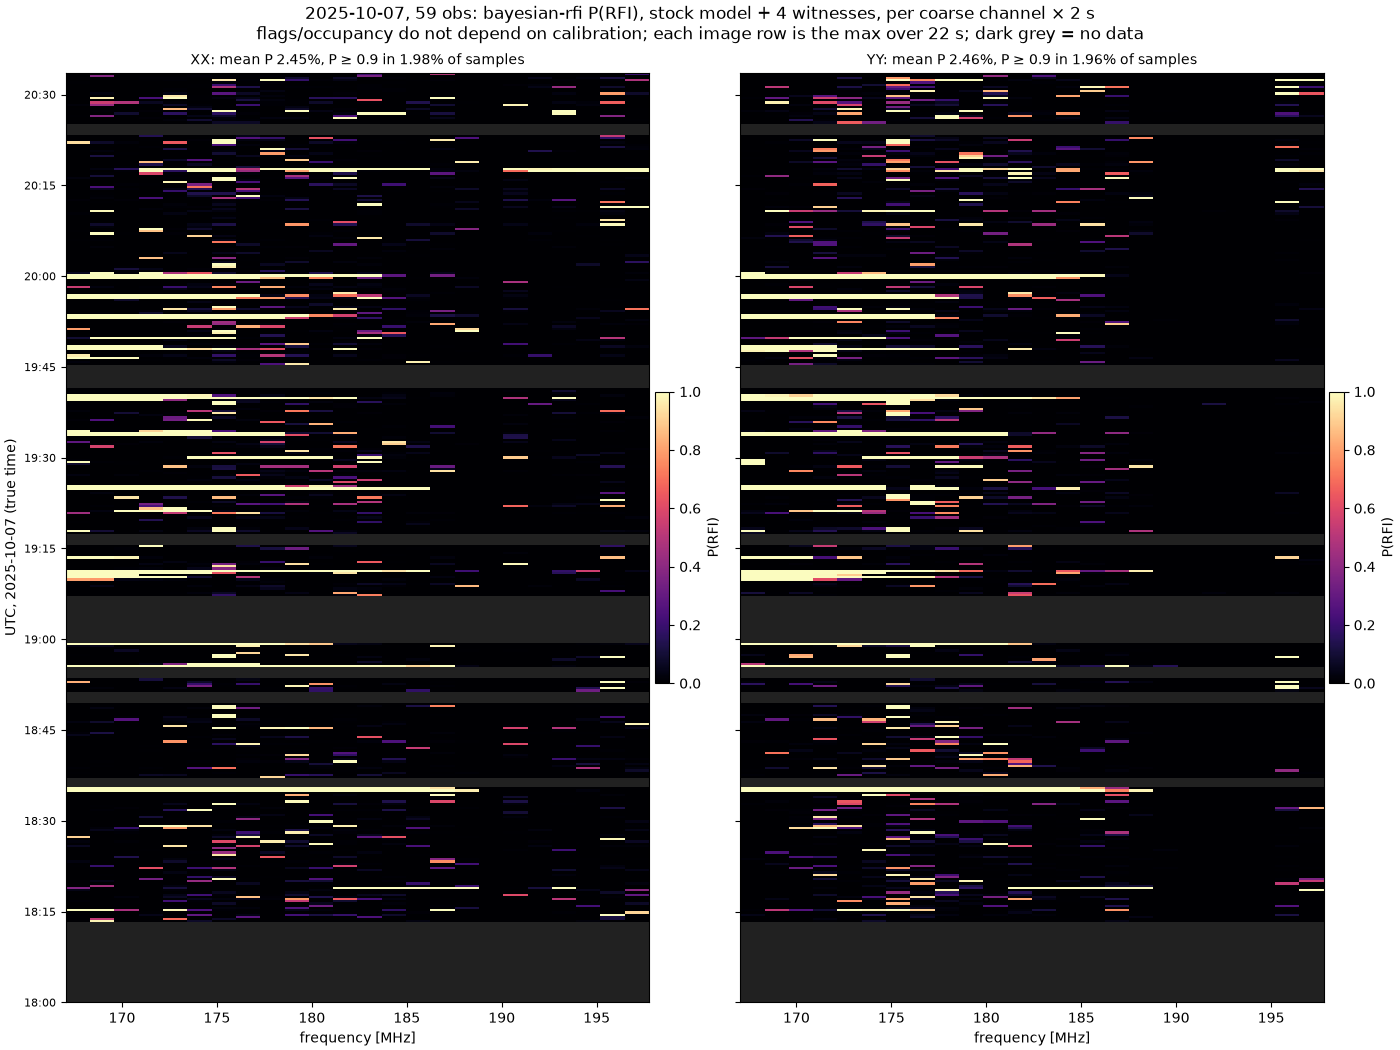
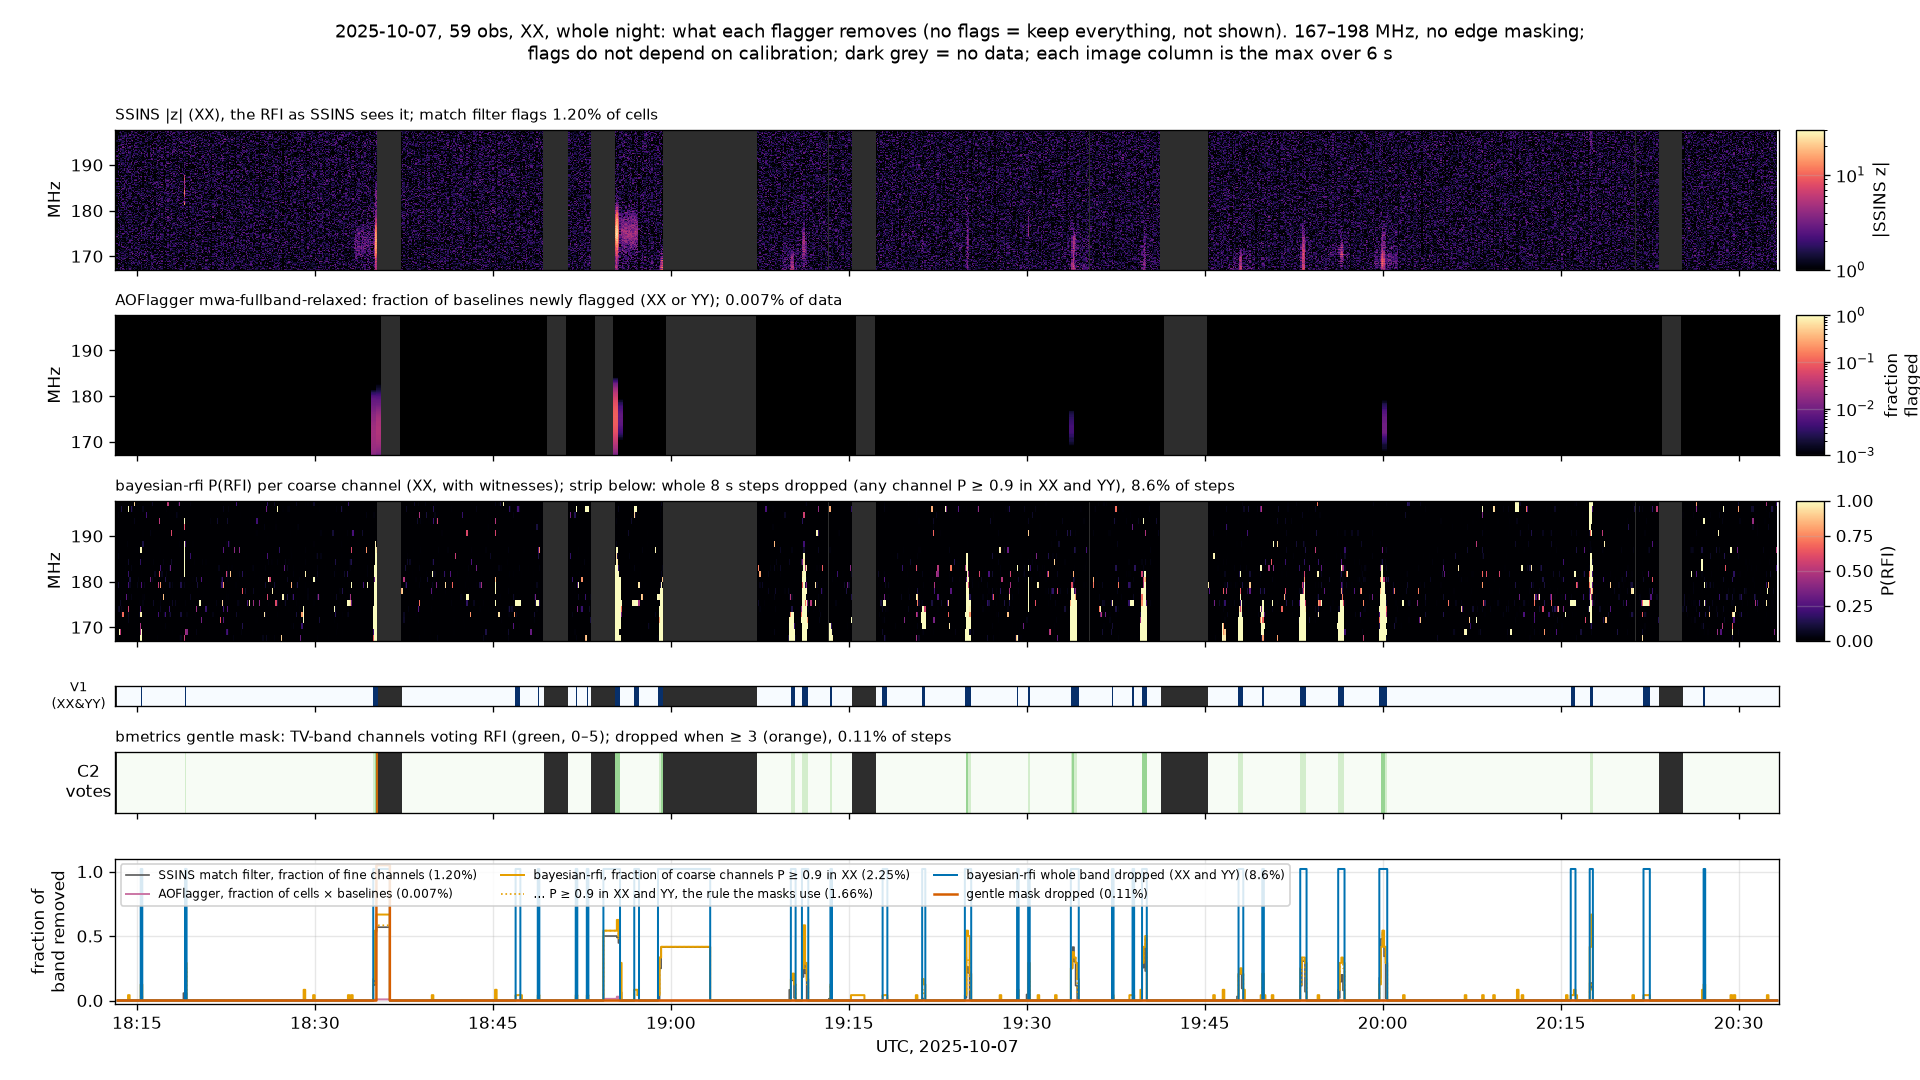
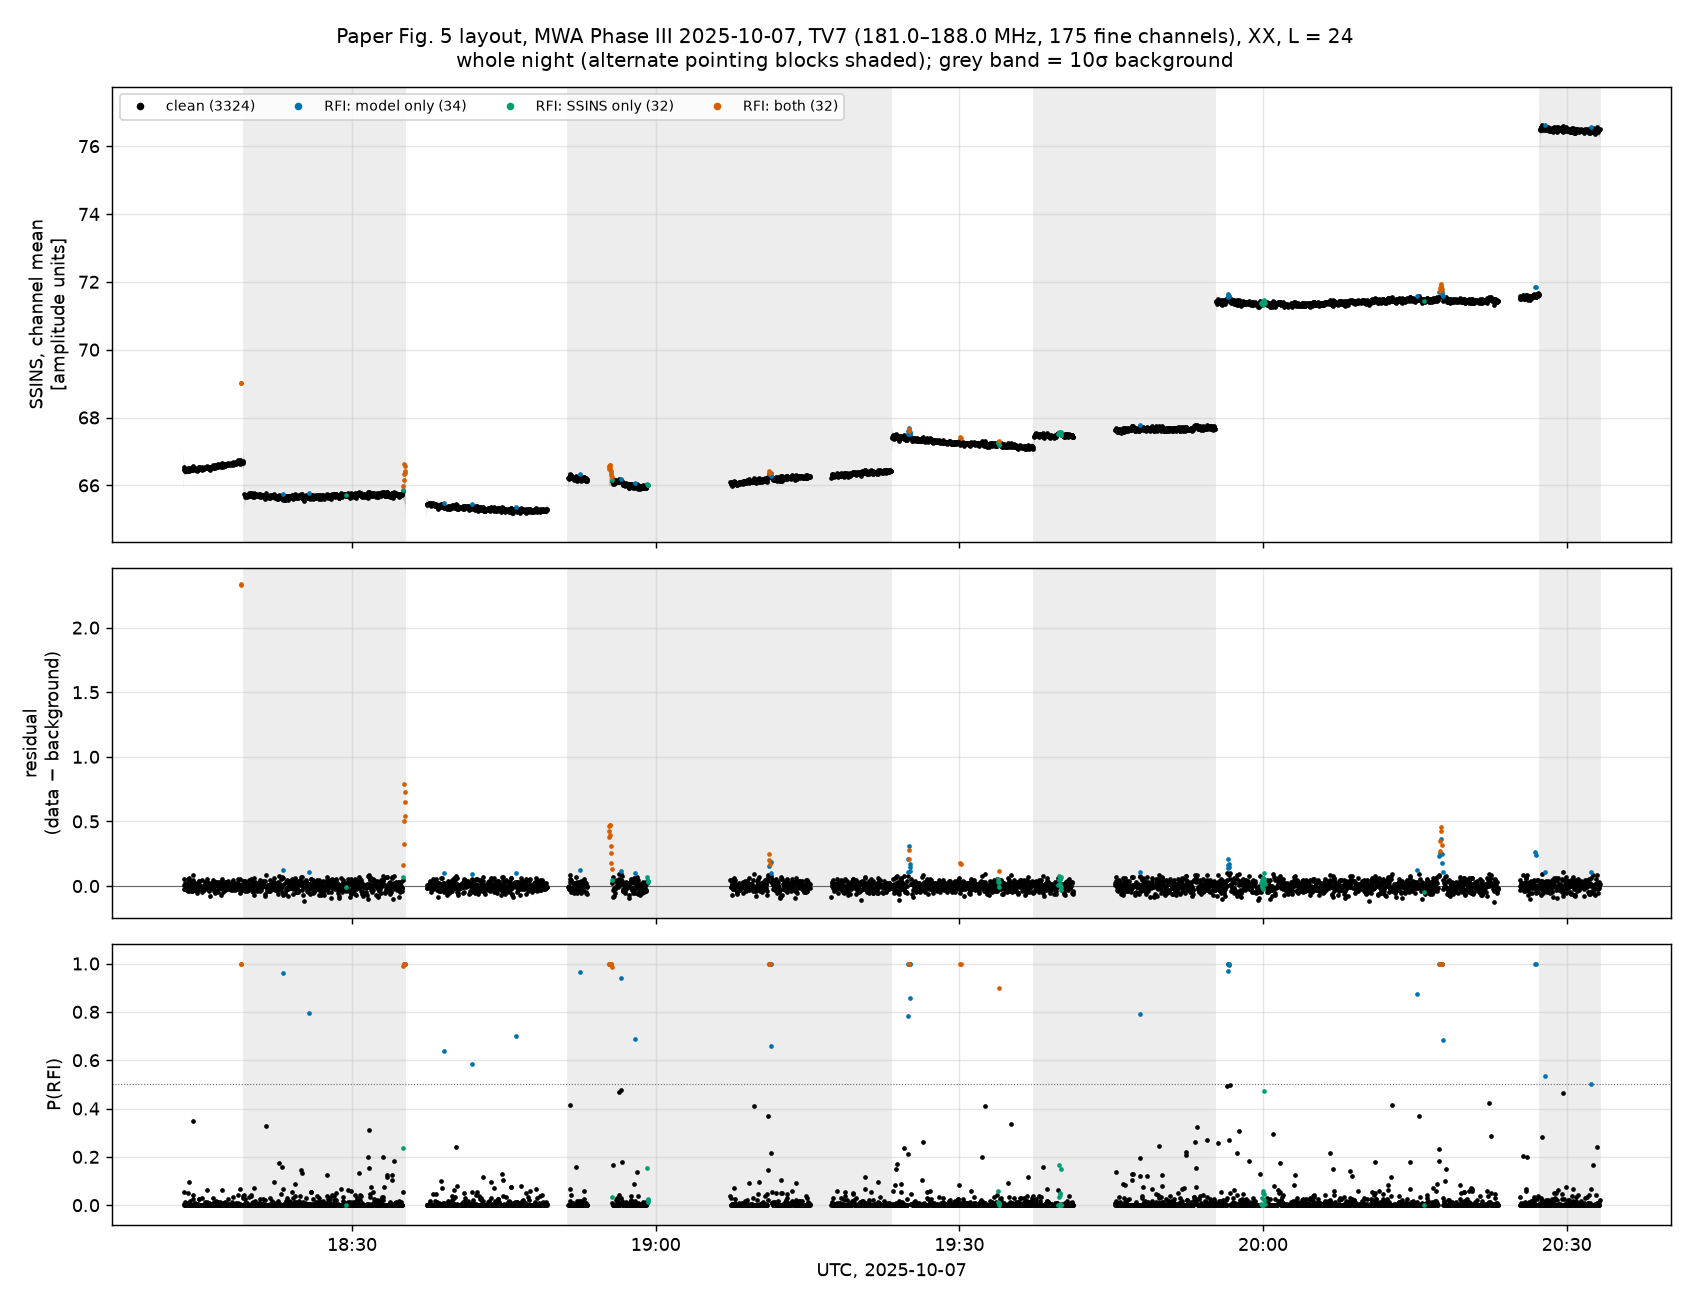
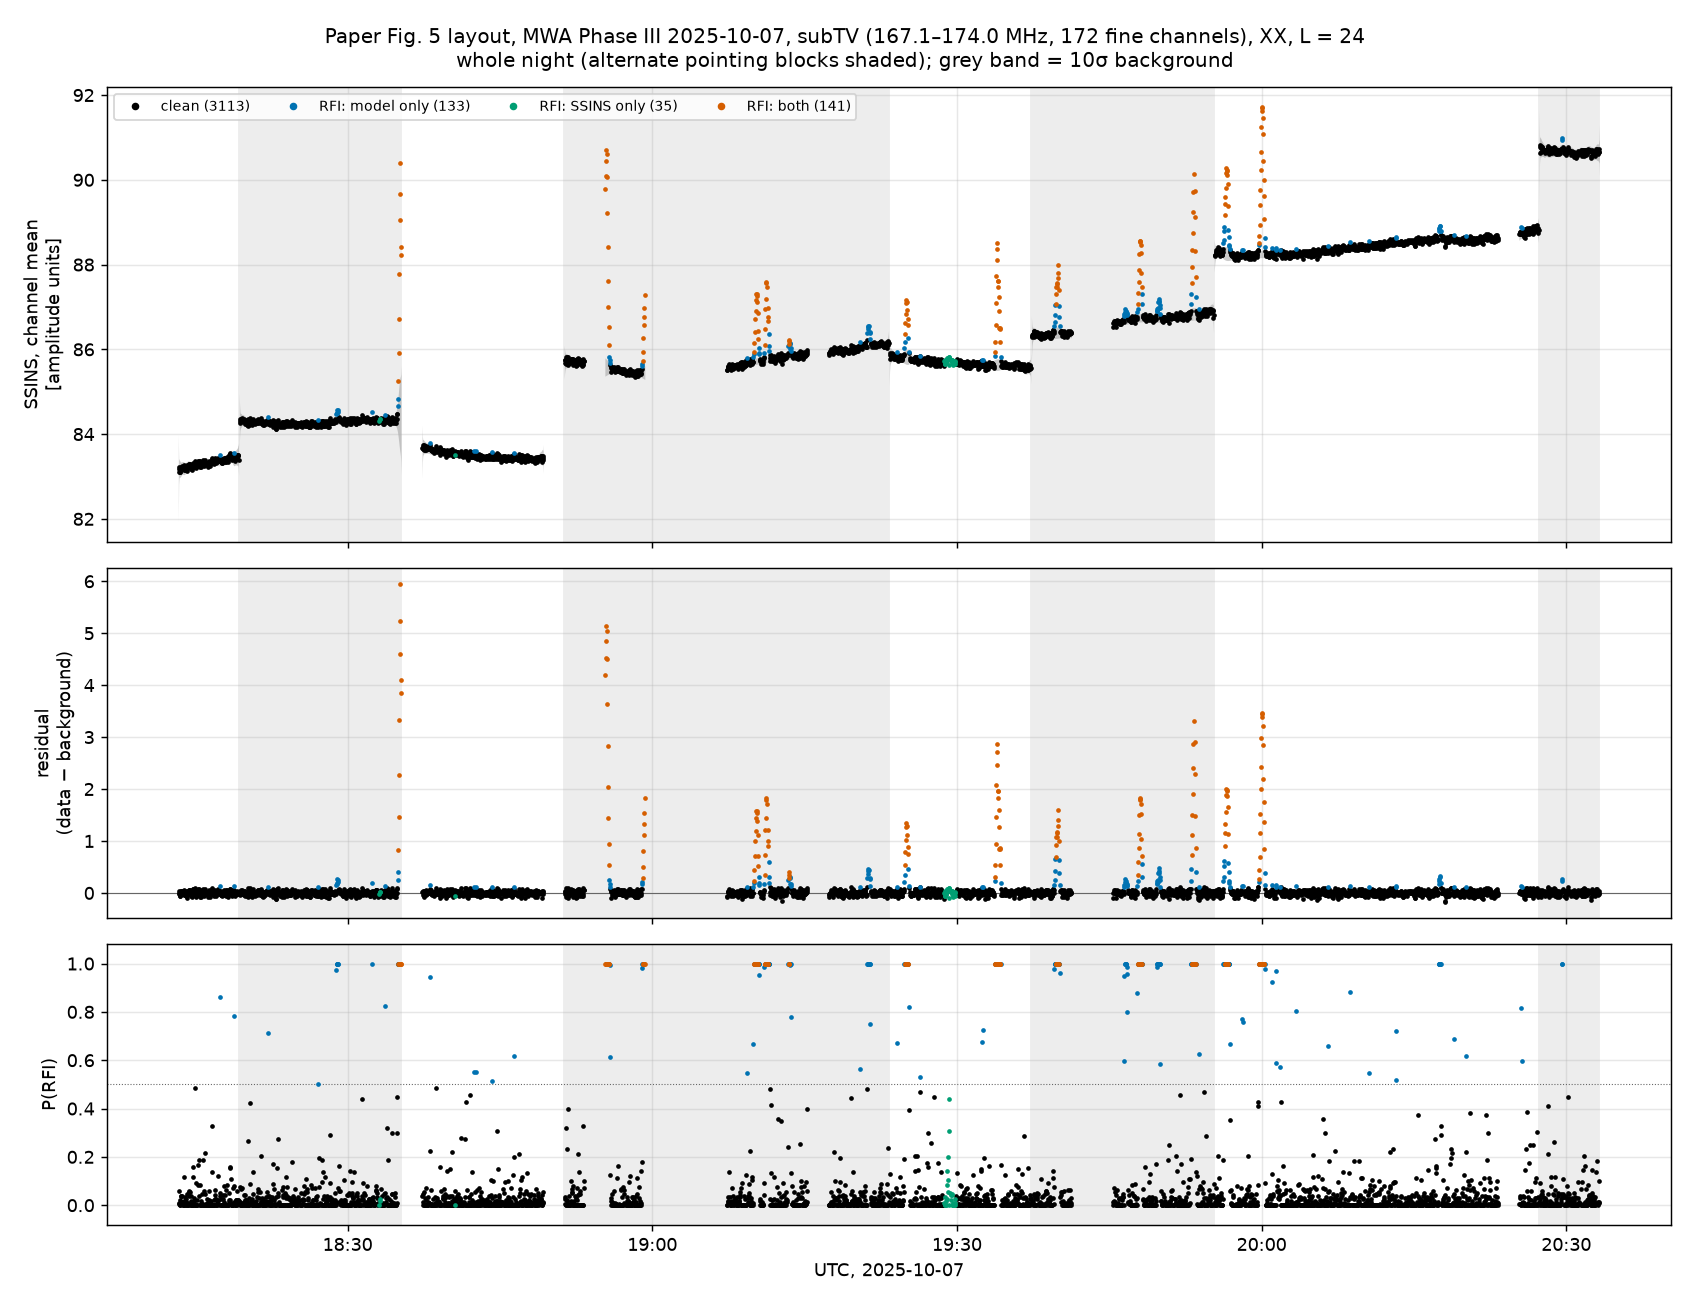
(more at the edges), 0.95 / 0.96 for tfcrop and 0.97 for SSINS, while the SSINS amplitude itself is flat across the coarse channel to 0.2%. Nothing is masked.bayesian-rfi P(RFI) per coarse channel × 2 s (stock model + EAVILS, AOFlagger, rflag, tfcrop as witnesses): mean P 2.45% (XX) / 2.46% (YY),
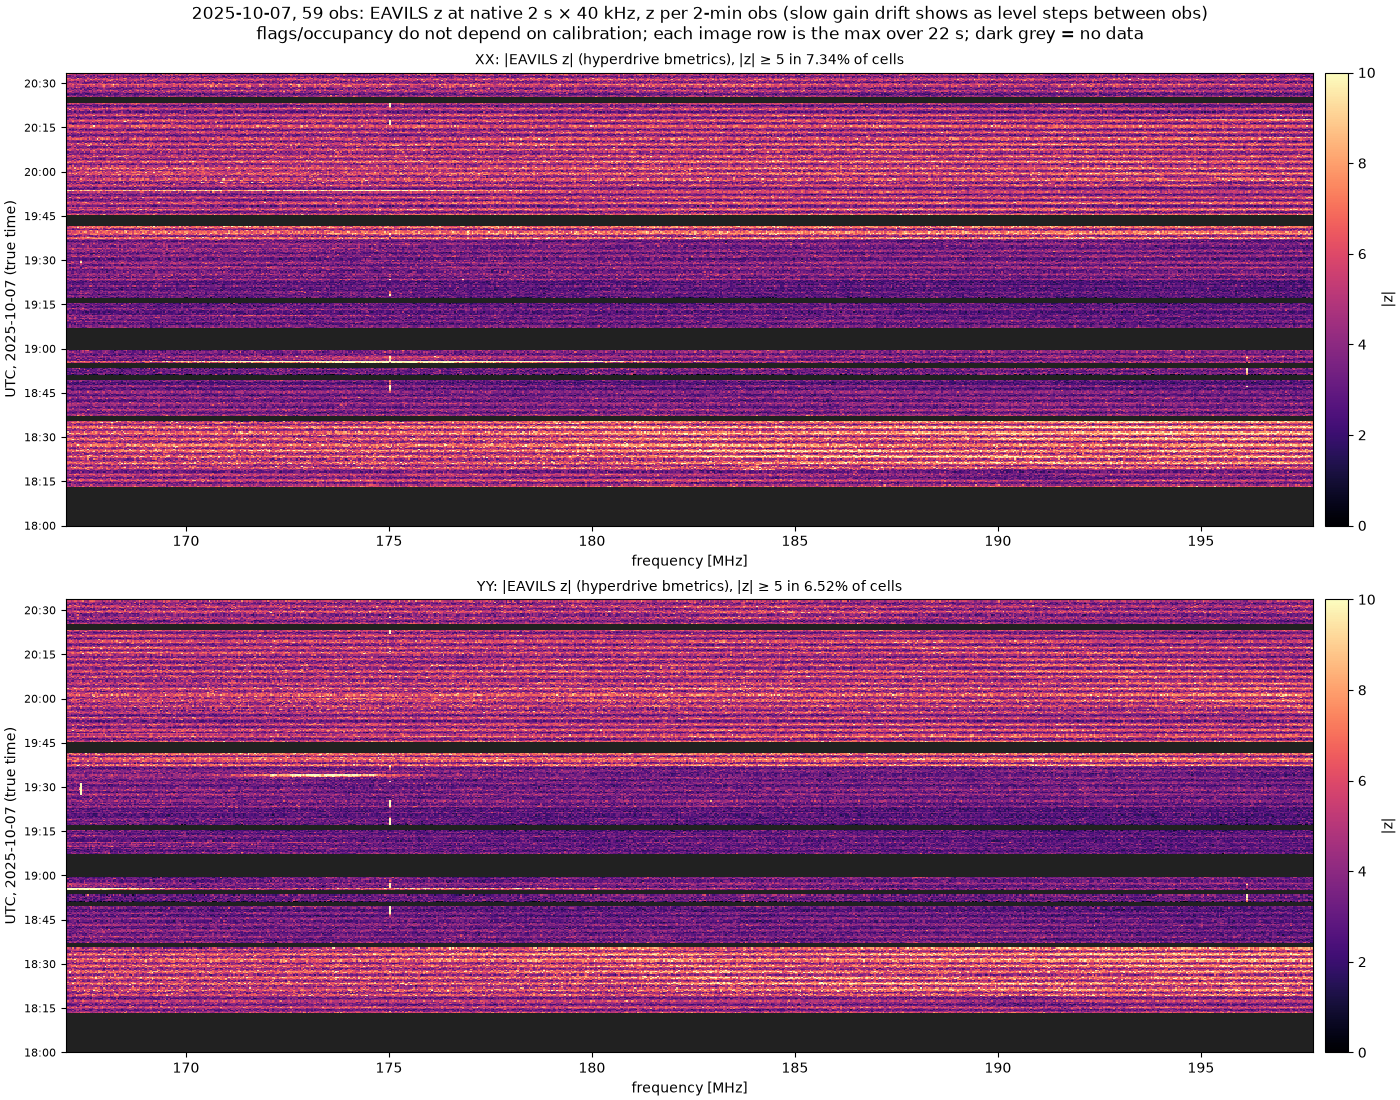
P ≥ 0.9 in 1.98% / 1.96% of samples. The RFI is broadband below ~185 MHz and chromatic.EAVILS |z| from hyperdrive bmetrics (max of |z| per image row), z per 2-min observation (slow gain drift shows as level changes between rows):
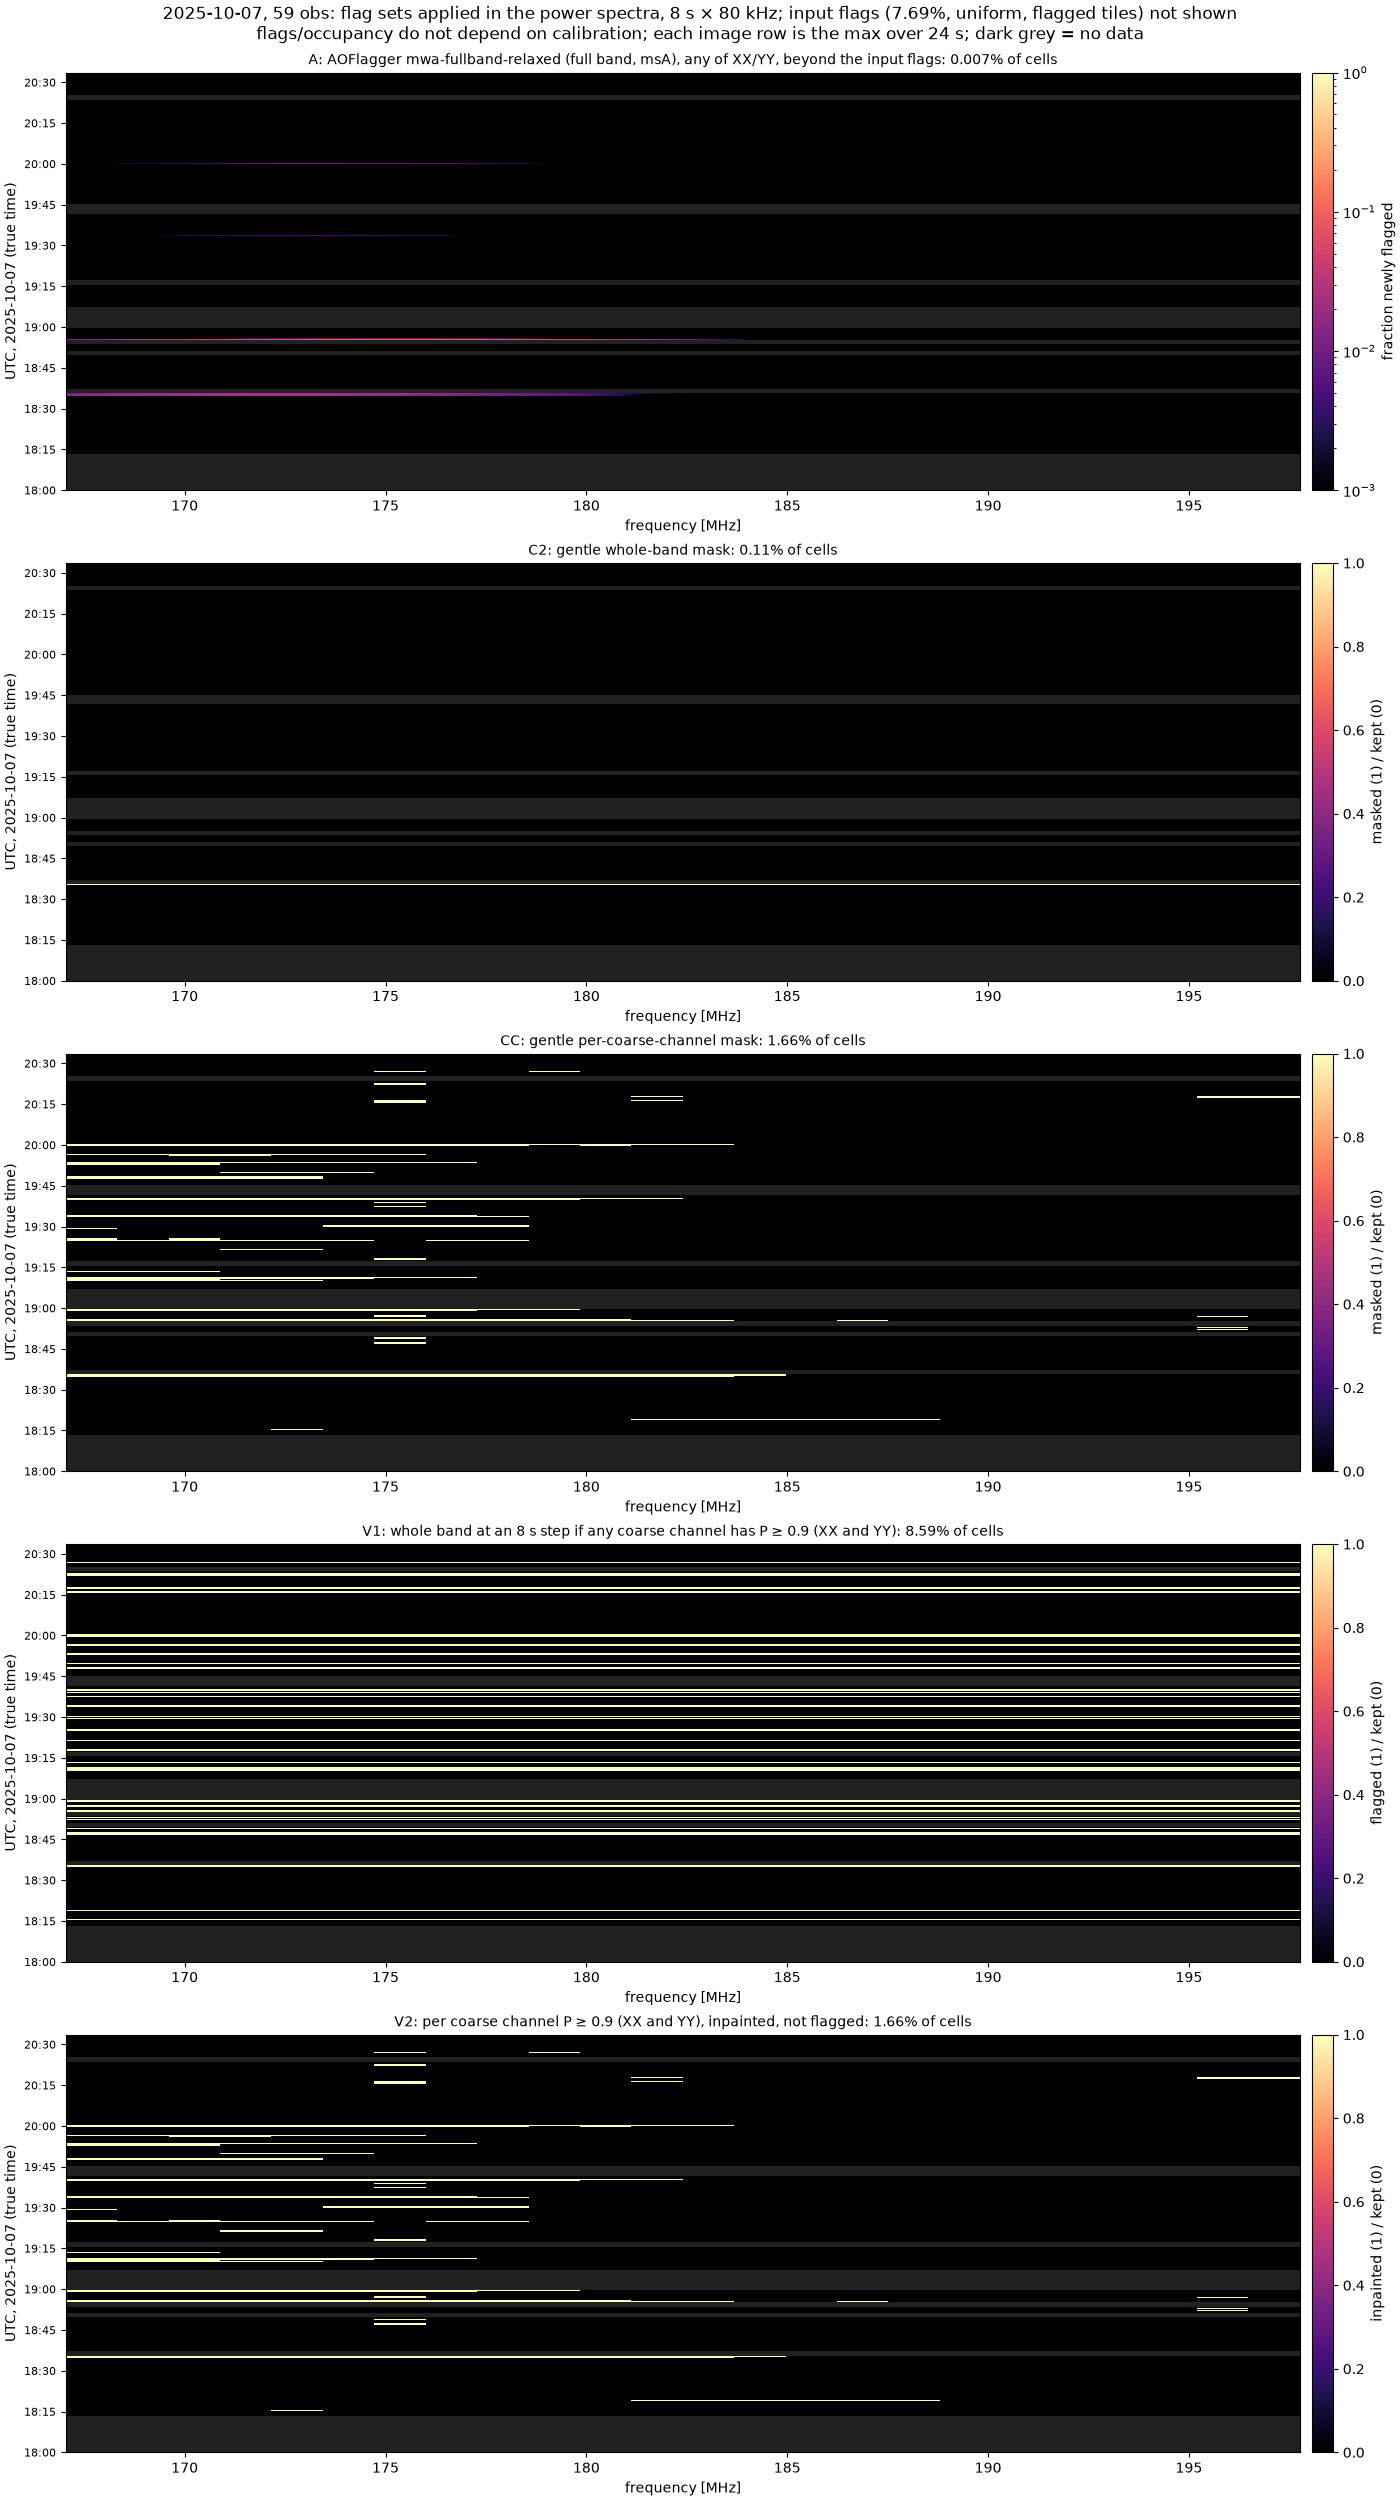
|z| ≥ 5 in 7.3% (XX) / 6.5% (YY) of cells. The witness fits use a night-renormalised version.Flag sets applied in the power spectra (8 s × 80 kHz): AOFlagger mwa-fullband-relaxed adds 0.007% beyond the input flags
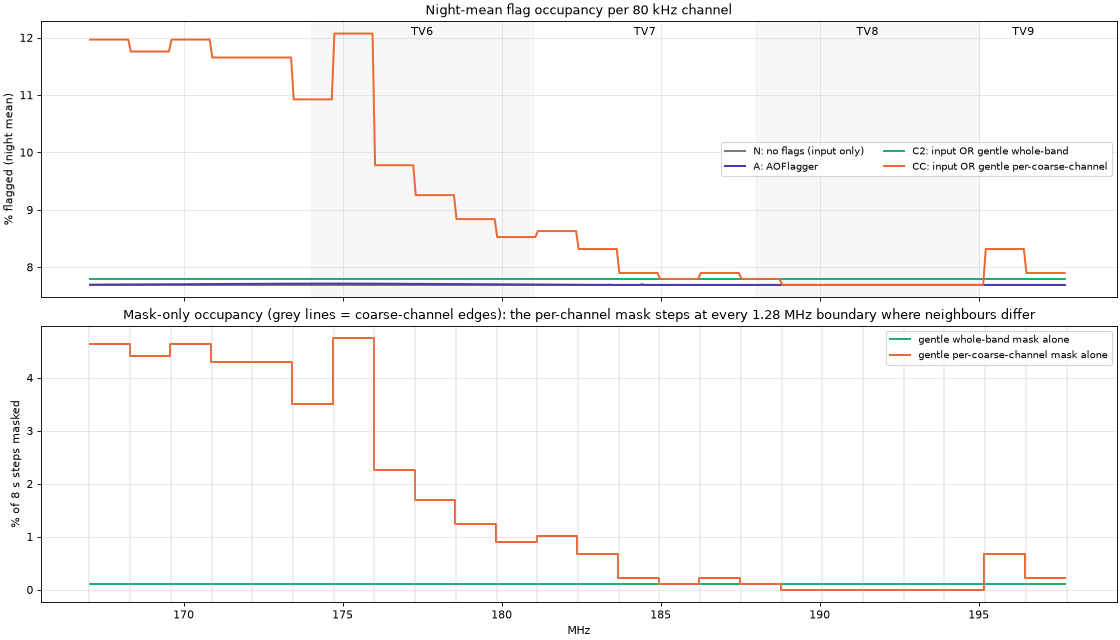
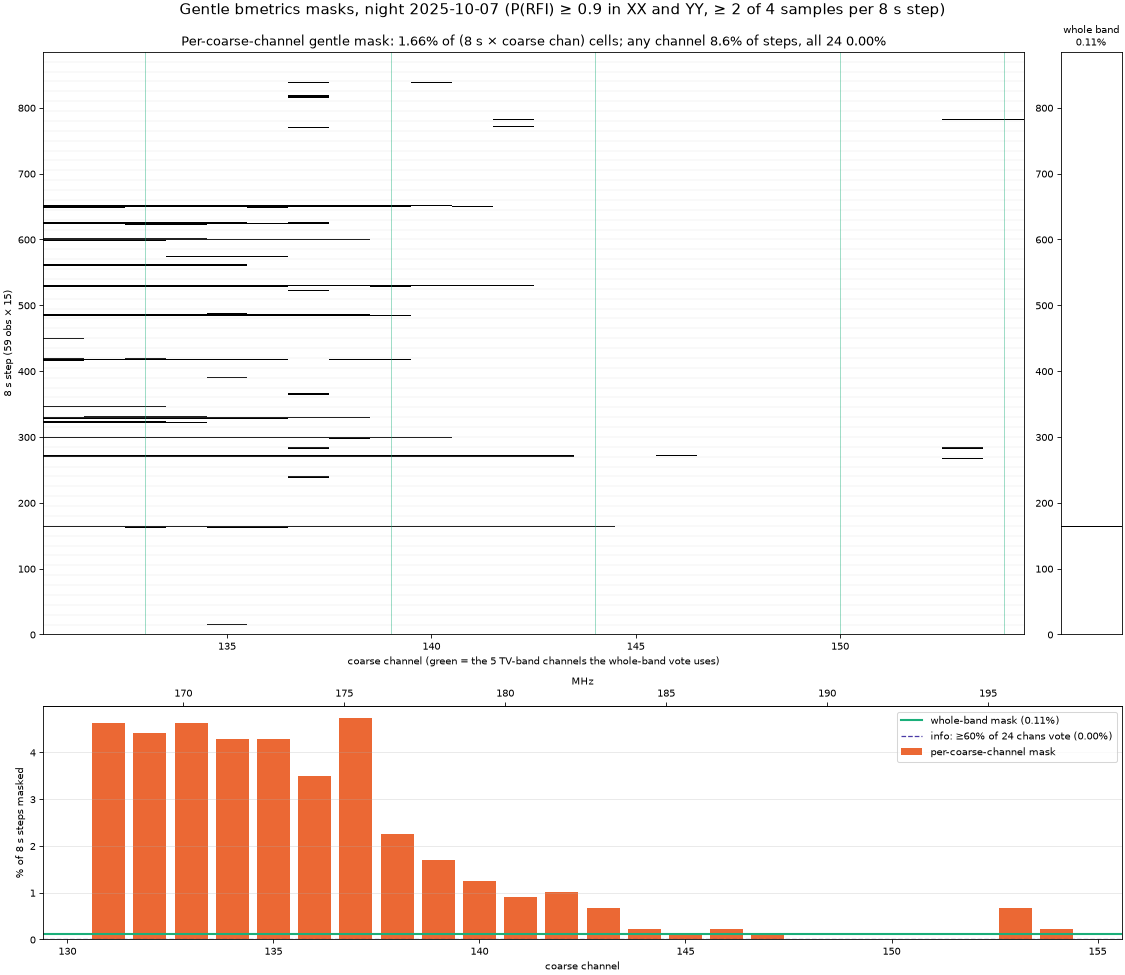
(7.69%, uniform, flagged tiles); C2 gentle whole-band mask 0.11%; CC per-coarse-channel mask 1.66%; V1 whole band if any channel is RFI 8.59%; V2 per-channel cells inpainted 1.66%.Night-mean flag occupancy per 80 kHz channel for the power-spectrum flag sets.Gentle bmetrics masks: per-coarse-channel decisions vs the whole-band vote.
What each flagger removes
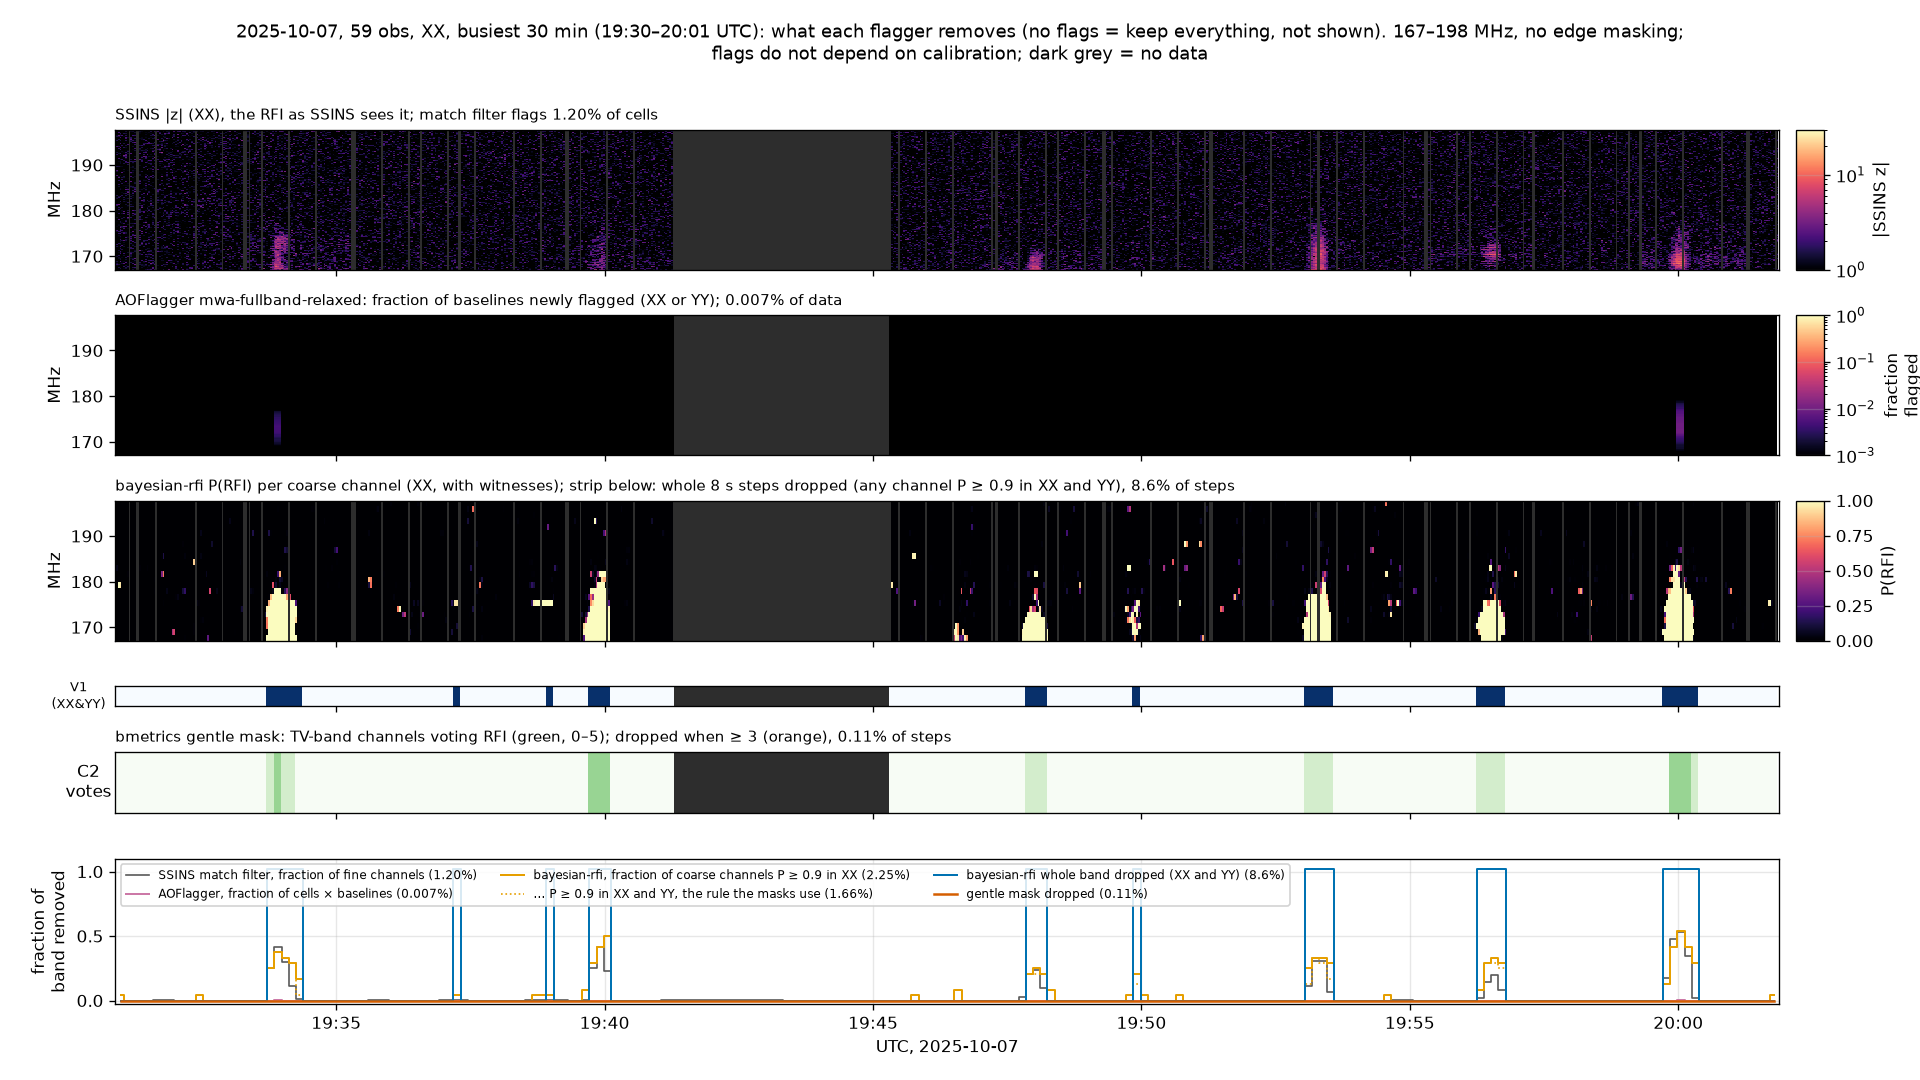
Time on x (true UTC), 167–198 MHz on y. Panels: SSINS |z|; AOFlagger mwa-fullband-relaxed new flags; bayesian-rfi (Ducharme, Li, Wilensky & Liu (2026)) P(RFI) per coarse channel with the whole-band steps it drops (needs XX and YY); the gentle mask's TV-channel votes; and the fraction of the band each removes per 8 s step, all on one time axis. Flags do not depend on calibration. Script: wf_flaggers.py.
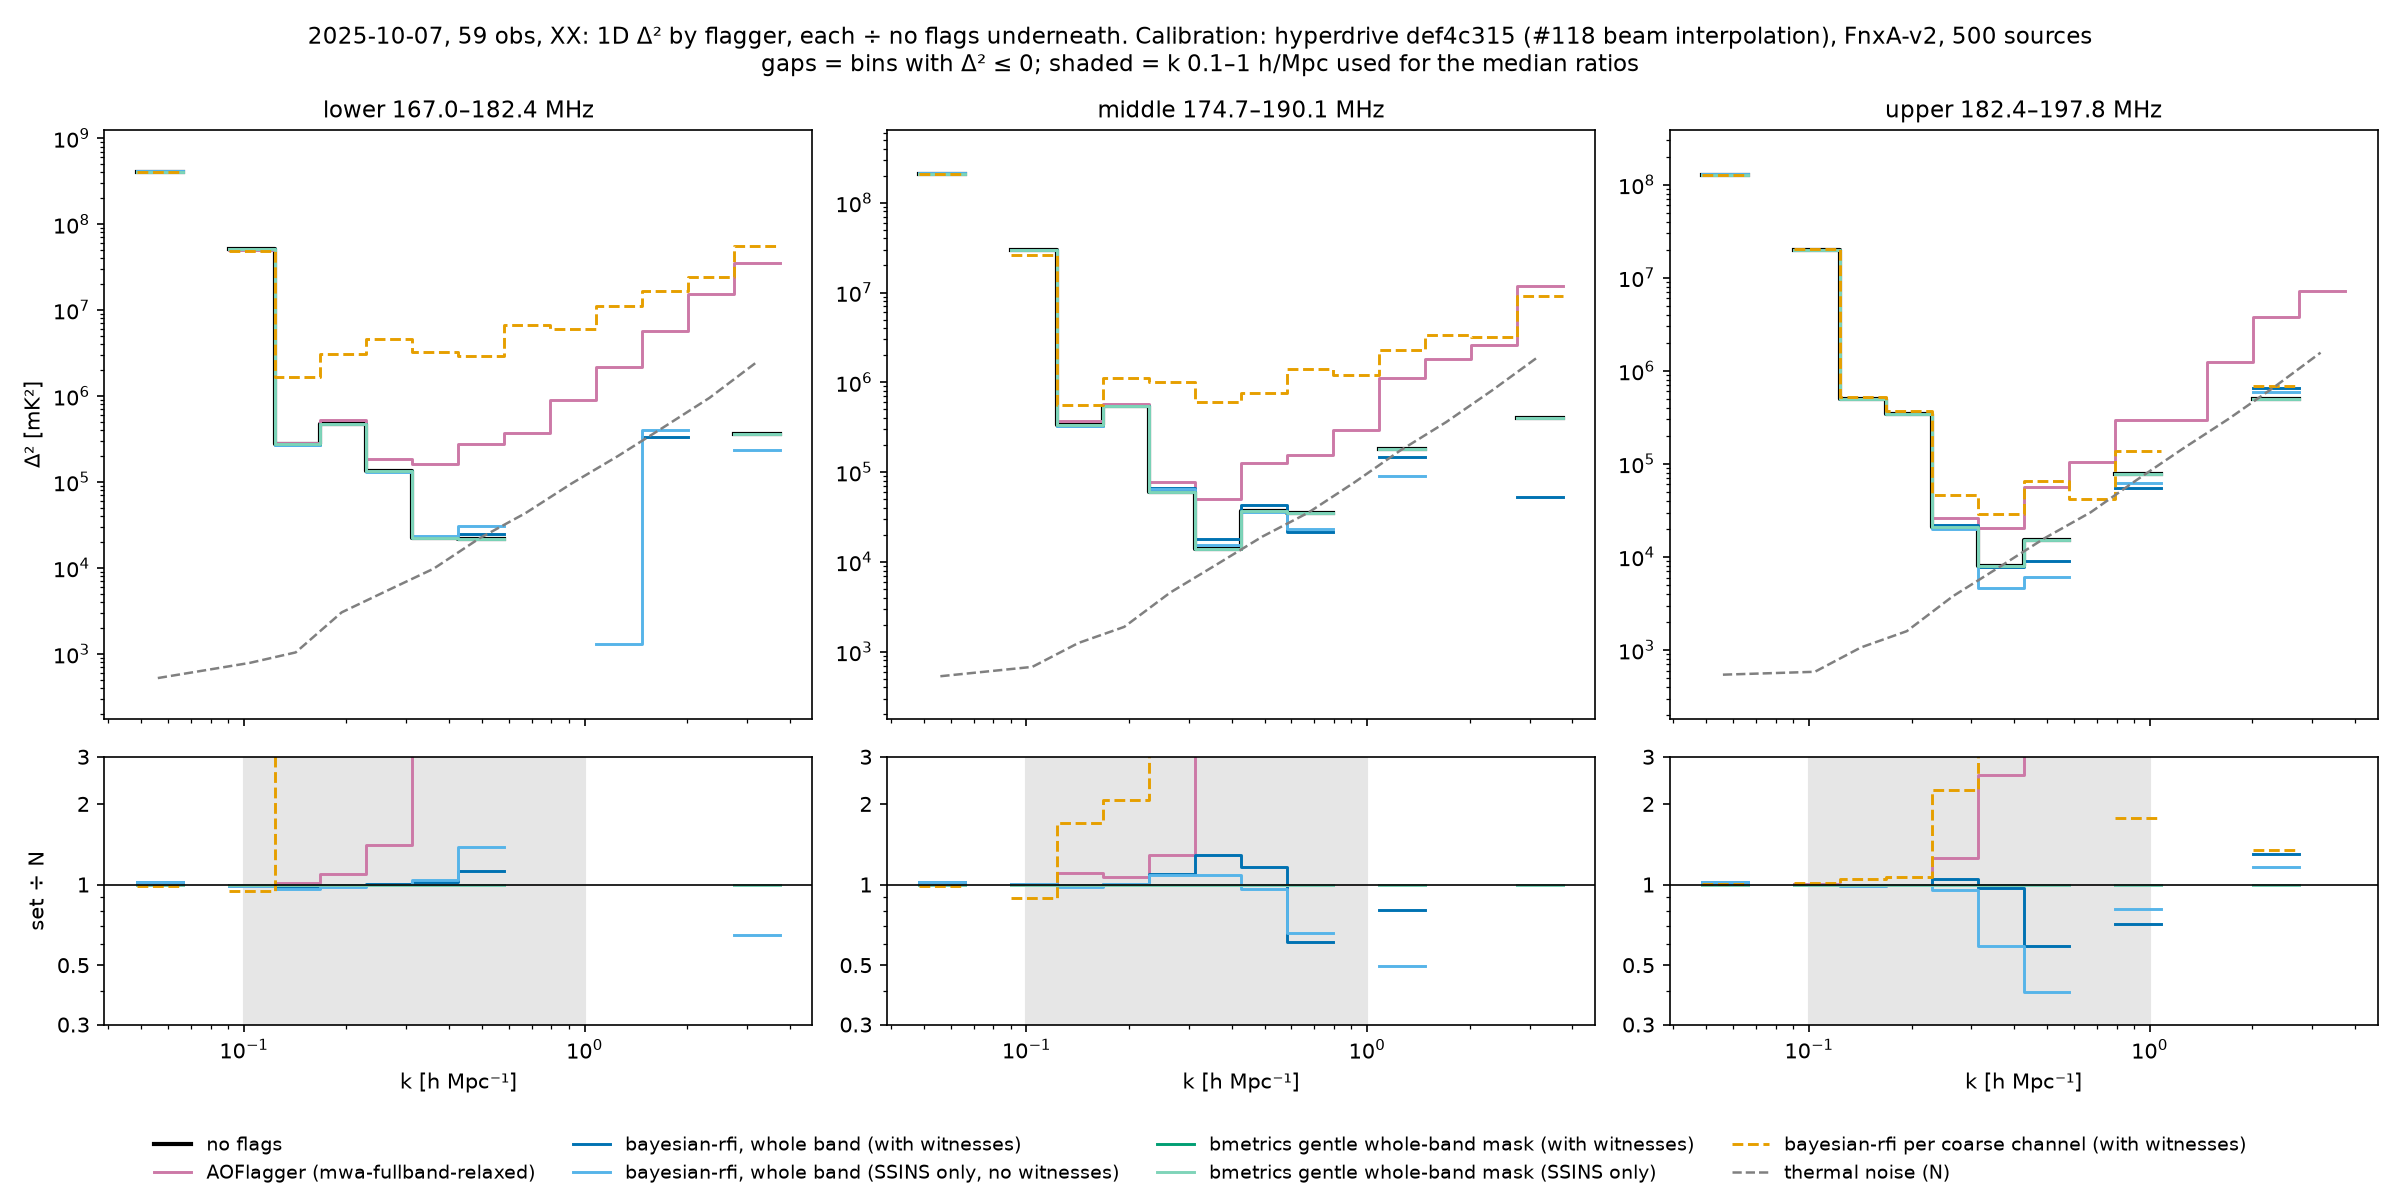
Four-way flagger comparison (added 2026-11-12). Witnesses (EAVILS, AOFlagger 1cc, CASA rflag, tfcrop as extra evidence in the bayesian-rfi fit) make no measurable difference to the power spectrum: the SSINS-only masks are within ±5%. Details in the gist.
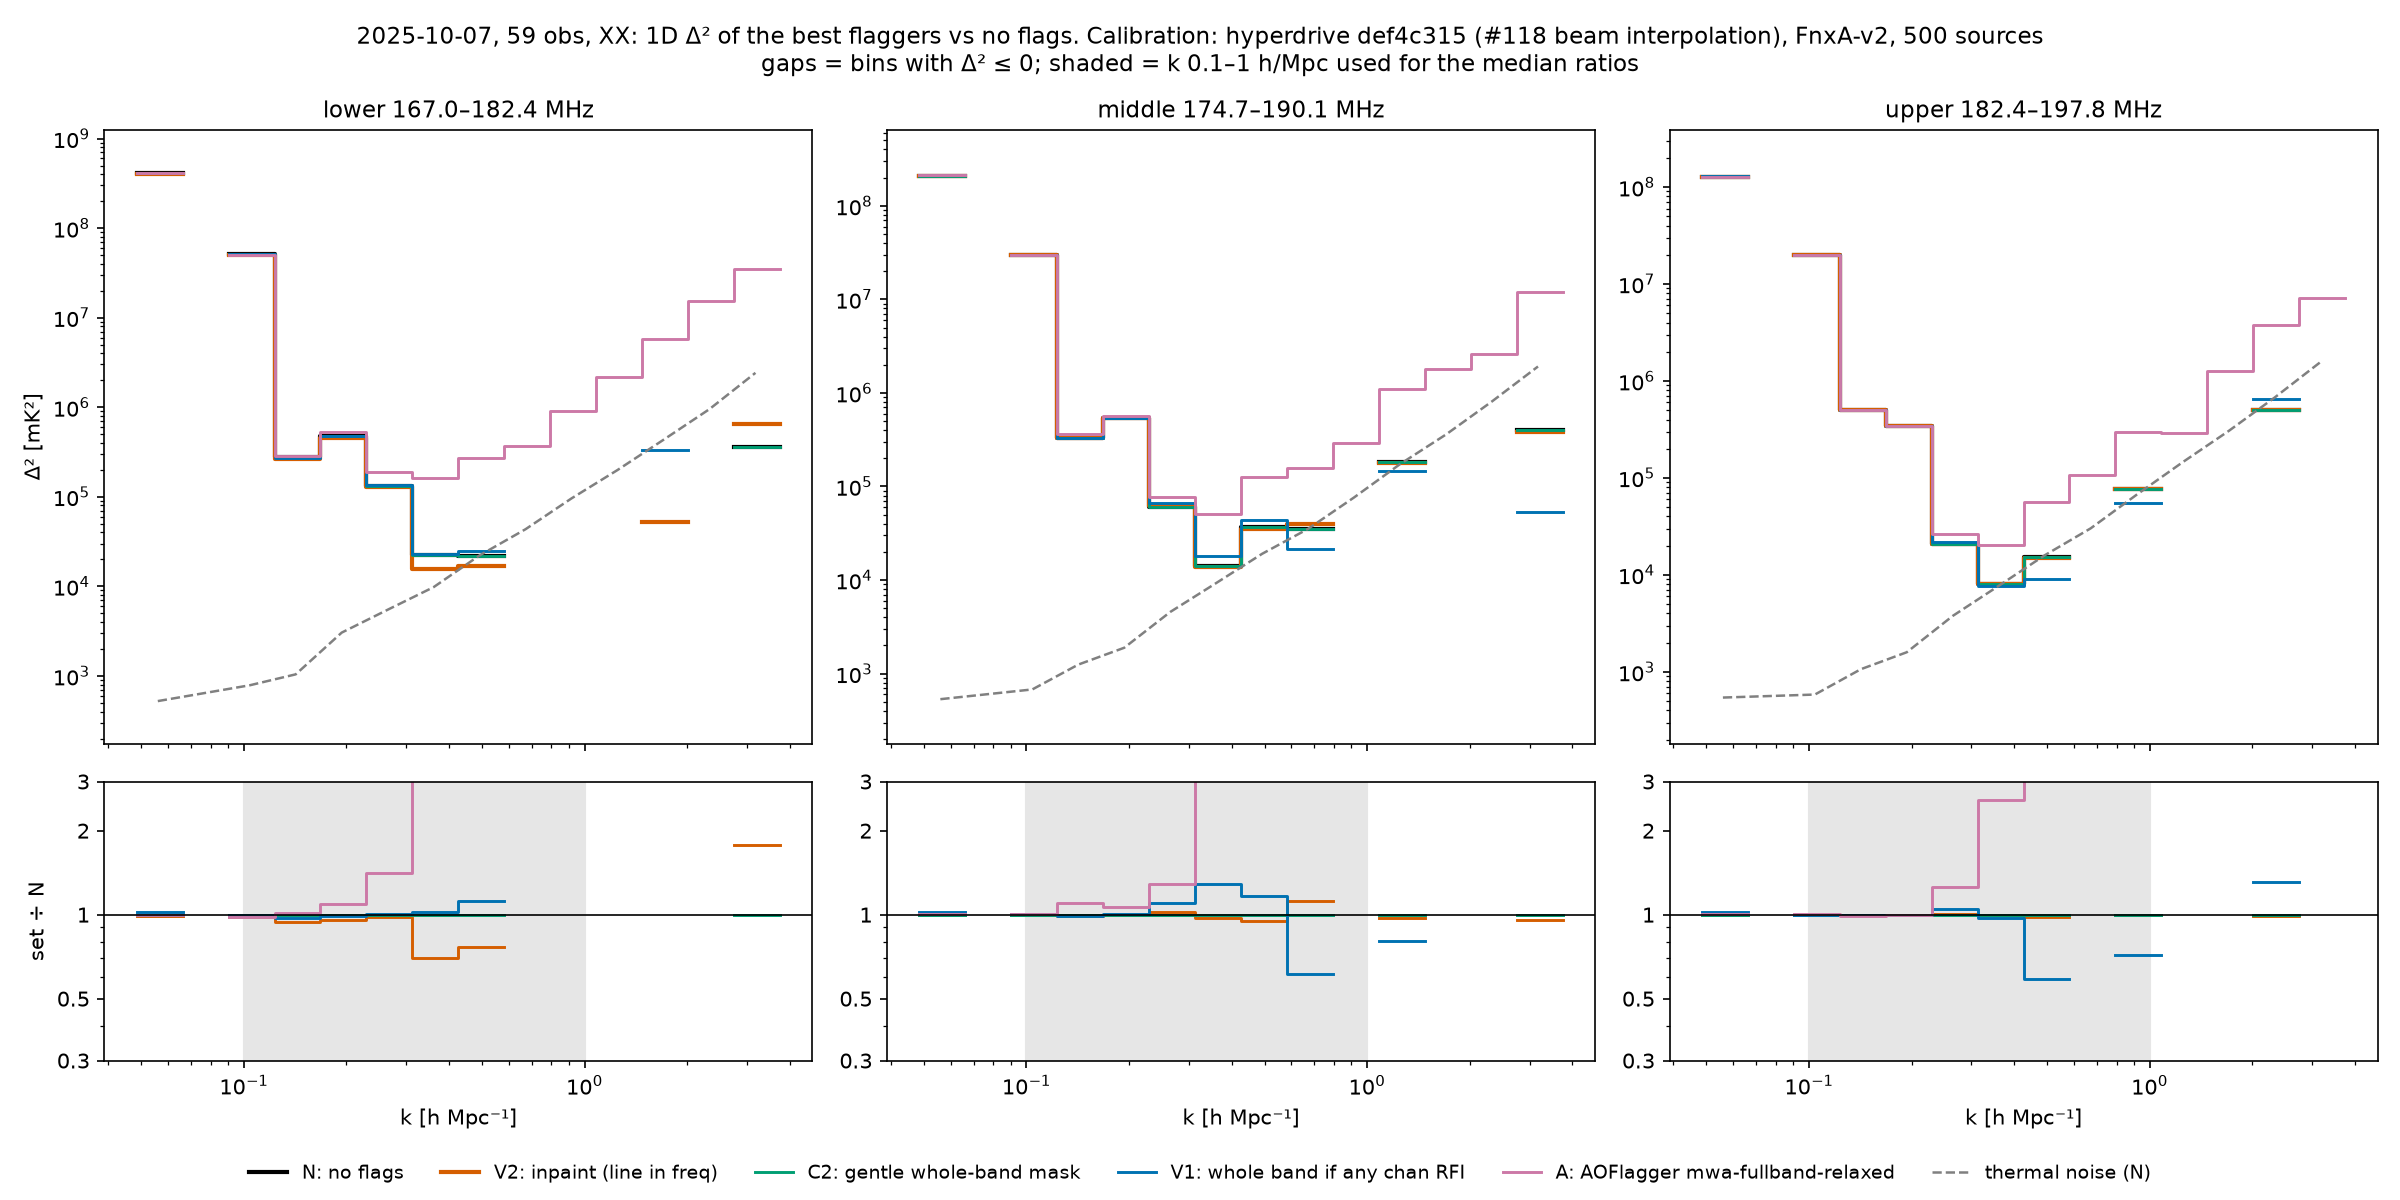
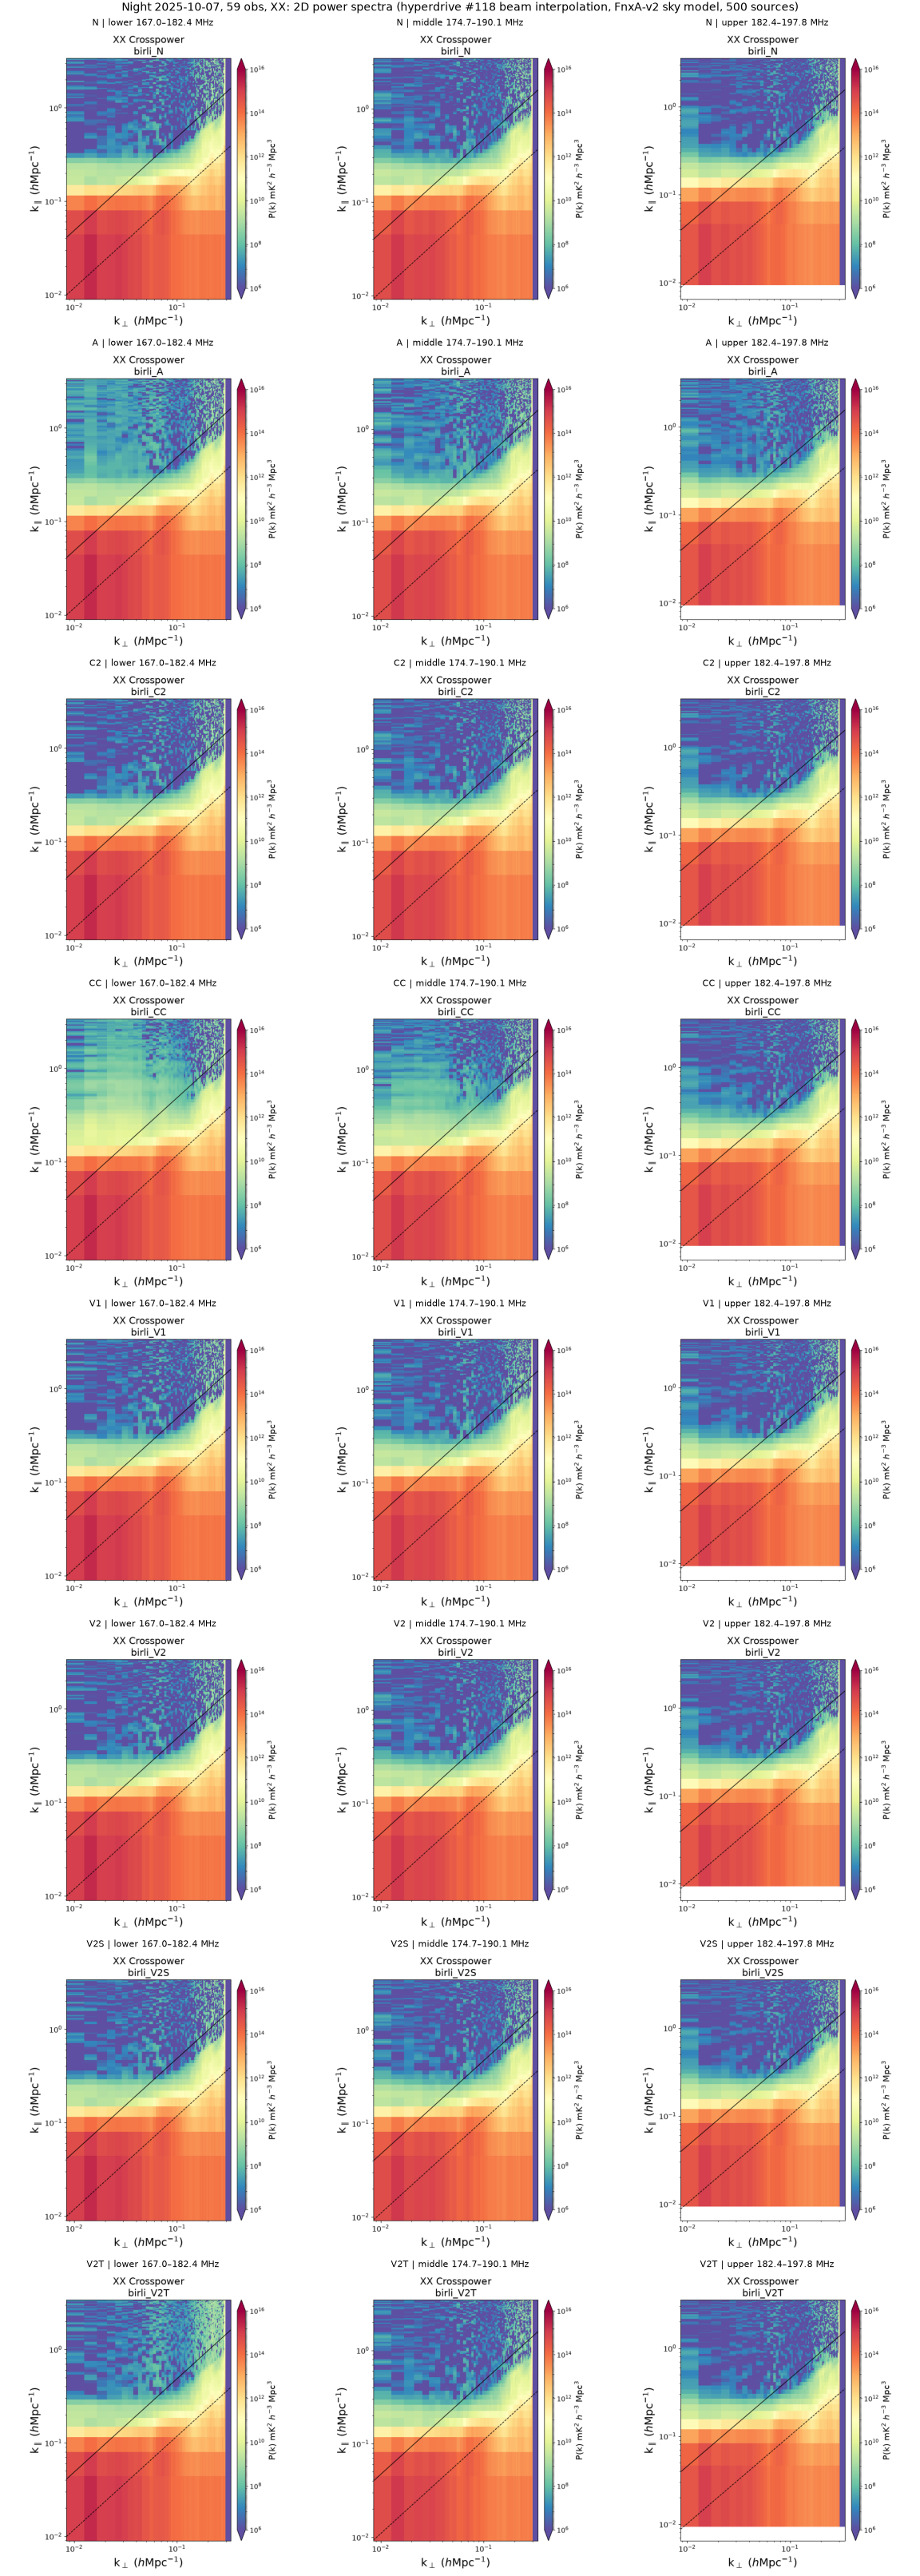
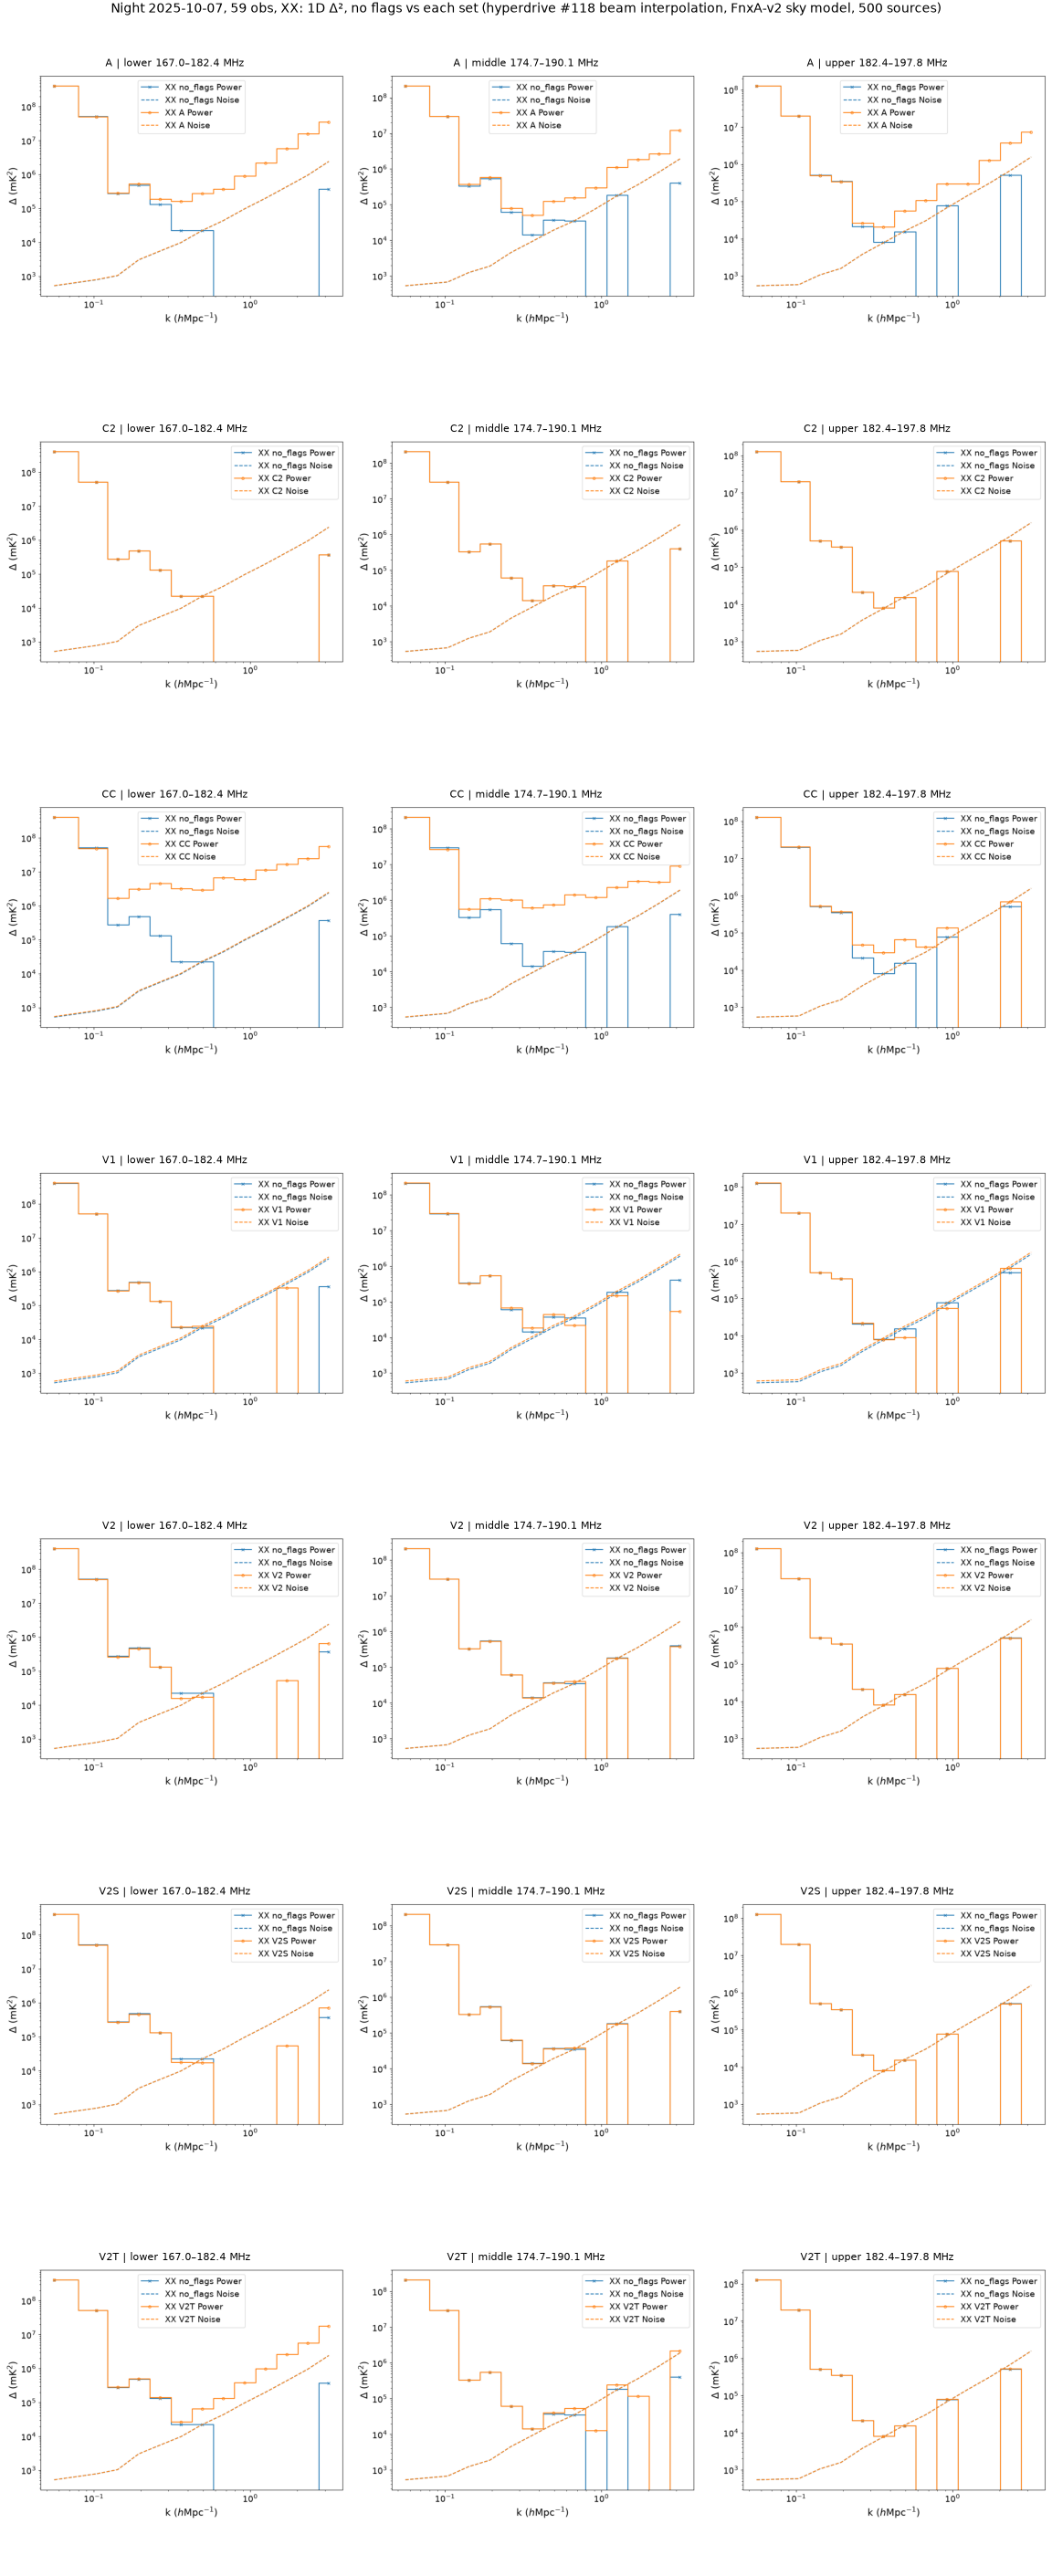
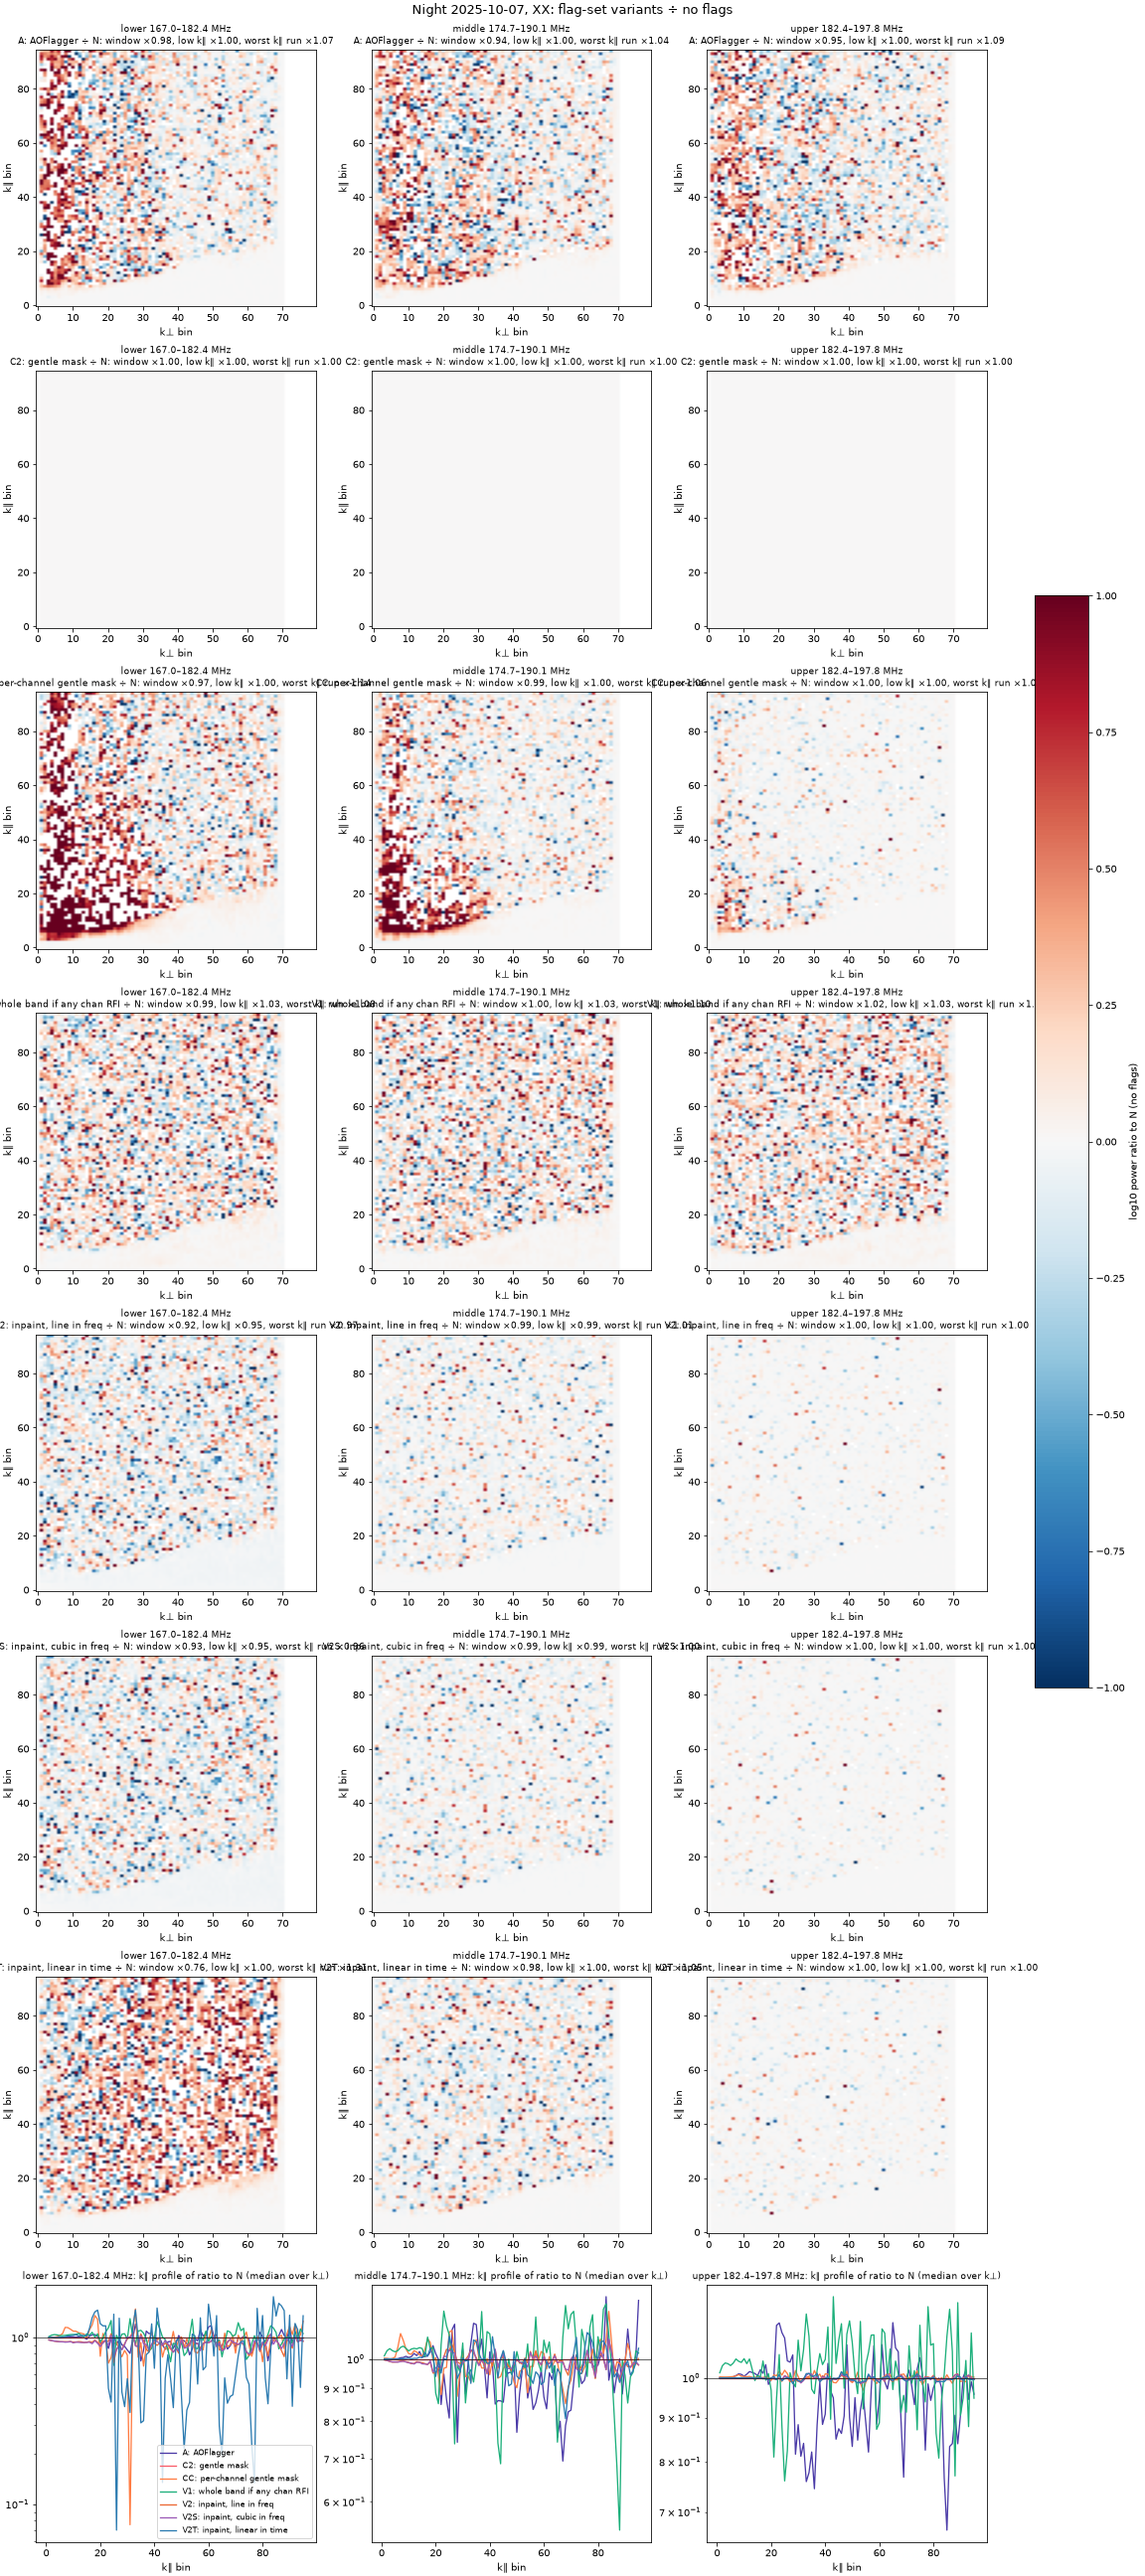
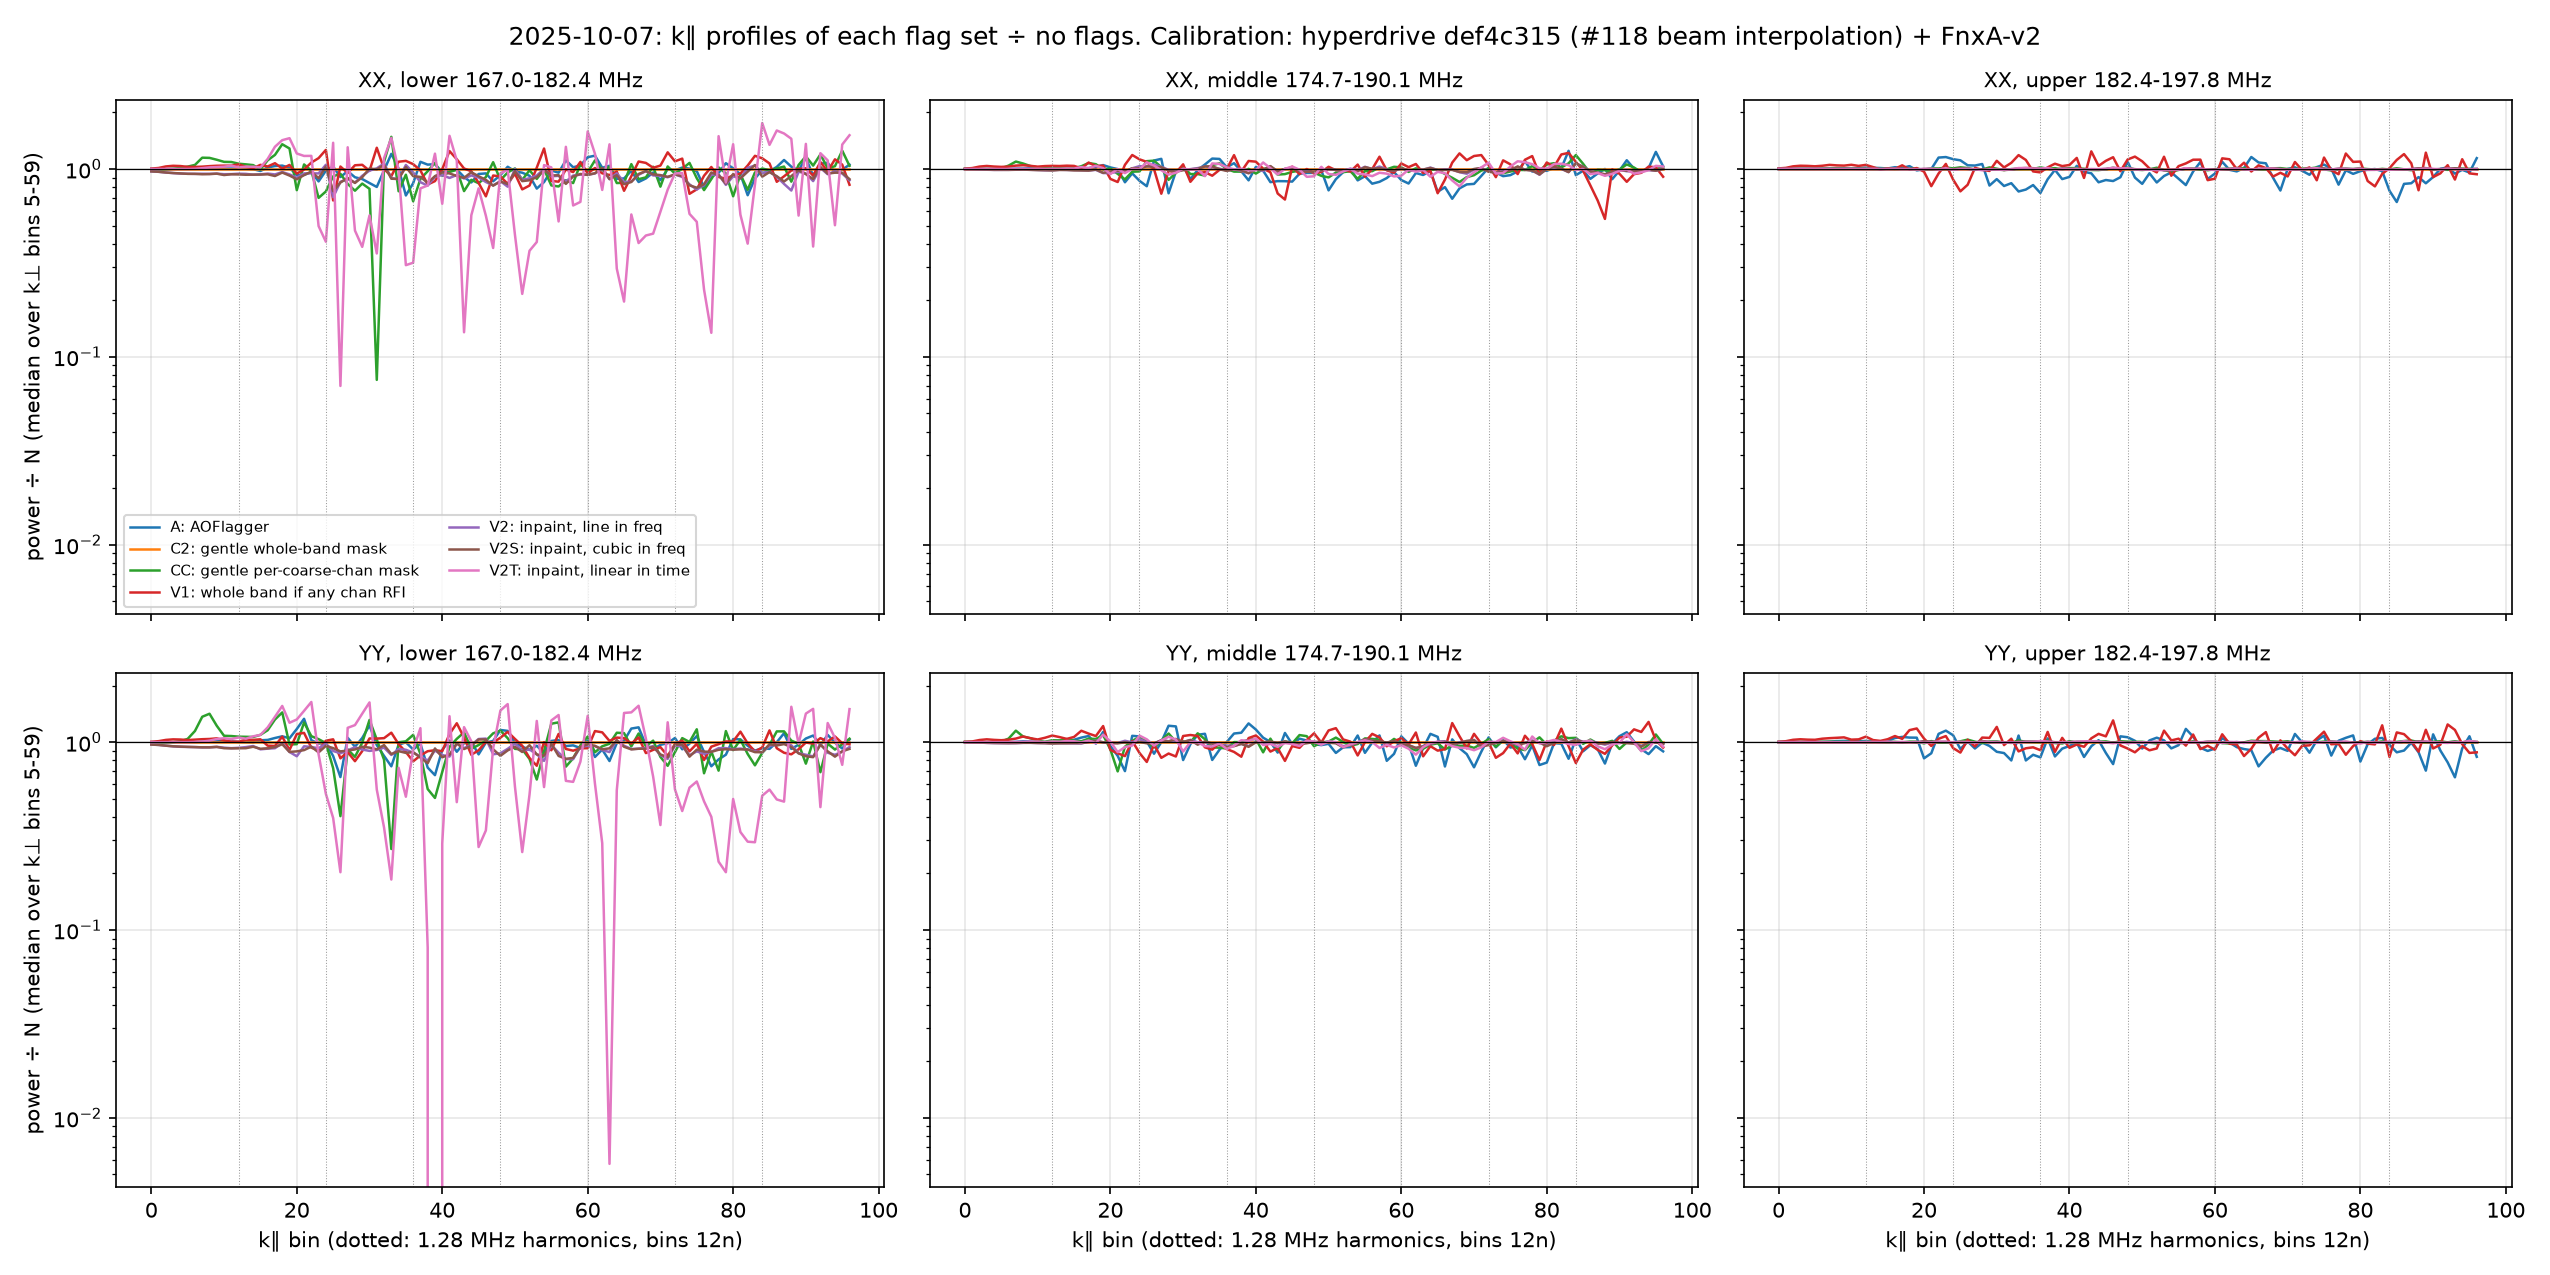
1D Δ² by flagger on shared axes, each ÷ no flags underneath, XX: no flags, AOFlagger, bayesian-rfi whole band and gentle mask, each with and without witnesses (hyperdrive def4c315, FnxA-v2). YY1D Δ² of the best flaggers on shared axes, each ÷ no flags underneath, XX (hyperdrive def4c315). YY2D power spectra of every set, XX (hyperdrive def4c315). YY1D Δ², no flags vs each set, XX (hyperdrive def4c315). YY2D power ratios to no flags, XX (hyperdrive def4c315). YYk∥ profiles of each set ÷ no flags, both pols and bands (hyperdrive def4c315).